| Multivariate Analyses |
Scatter Plot Matrix
Scatter plots are displayed for pairs of variables. Without X variables, scatter plots are displayed as a symmetric matrix containing each pair of Y variables. With a nominal Y variable, scatter plots are displayed as a symmetric matrix containing each pair of X variables. When both interval Y variables and interval X variables are selected, scatter plots are displayed as a rectangular matrix with Y variables as the row variables and X variables as the column variables.
Figure 40.35 displays part of a scatter plot matrix with 80% prediction confidence ellipses.
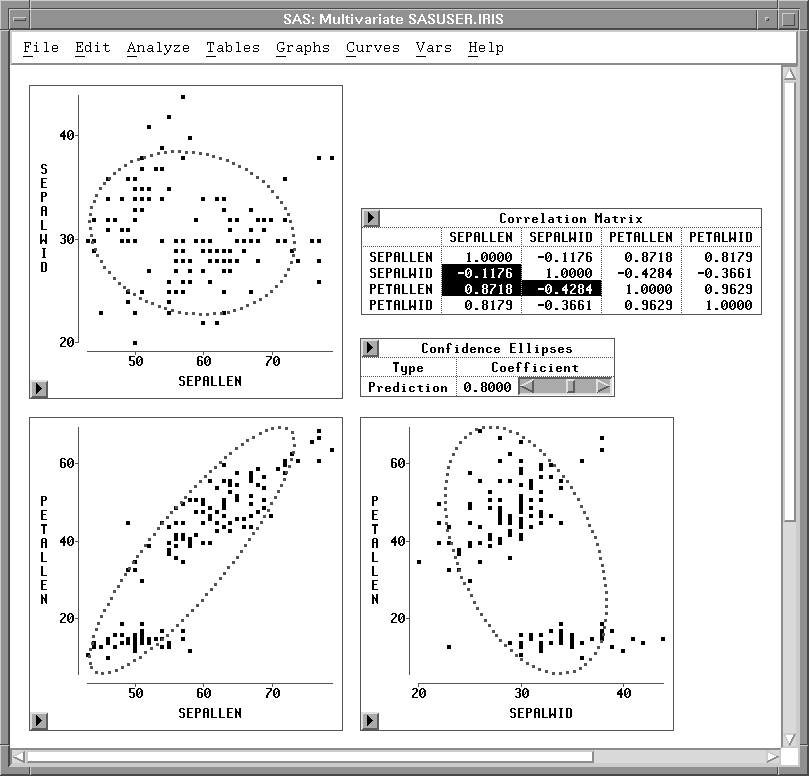
Figure 40.35: Scatter Plot Matrix with 80% Prediction Confidence Ellipses
Copyright © 2007 by SAS Institute Inc., Cary, NC, USA. All rights reserved.