| Fit Analyses |
Parametric Curves: Confidence Ellipses
SAS/INSIGHT software provides two types of confidence ellipses for each pair of X and Y variables assuming a bivariate normal distribution. One is a confidence ellipse for the population mean, and the other is a confidence ellipse for prediction.
Let ![]() and S be the sample mean and the unbiased estimate of the covariance matrix of a random sample of size n from a bivariate normal distribution with mean
and S be the sample mean and the unbiased estimate of the covariance matrix of a random sample of size n from a bivariate normal distribution with mean ![]() and covariance matrix
and covariance matrix ![]() .
.
The variable ![]() is distributed as a bivariate normal variate with mean 0 and covariance
is distributed as a bivariate normal variate with mean 0 and covariance ![]() ,and it is independent of S. The confidence ellipse for
,and it is independent of S. The confidence ellipse for ![]() is based on Hotelling's T2 statistic:
is based on Hotelling's T2 statistic:
A ![]() confidence ellipse for
confidence ellipse for ![]() is defined by the equation
is defined by the equation
A confidence ellipse for prediction is a confidence region for predicting a new observation in the population. It also approximates a region containing a specified percentage of the population.
Consider Z as a bivariate random variable for a new observation. The variable ![]() is distributed as a bivariate normal variate with mean 0 and covariance
is distributed as a bivariate normal variate with mean 0 and covariance ![]() ,and it is independent of S.
,and it is independent of S.
A ![]() confidence ellipse for prediction is then given by the equation
confidence ellipse for prediction is then given by the equation
The family of ellipses generated by different F critical values has a common center (the sample mean) and common major and minor axes.
The ellipses graphically indicate the correlation between two variables. When the variable axes are standardized (by dividing the variables by their respective standard deviations), the ratio of the two axis lengths (in Euclidean distances) reflects the magnitude of the correlation between the two variables. A ratio of 1 between the major and minor axes corresponds to a circular confidence contour and indicates that the variables are uncorrelated. A larger value of the ratio indicates a larger positive or negative correlation between the variables.
You can choose the level of the confidence region from the Confidence Ellipse menus, as illustrated by Figure 39.34.
![[menu]](images/fit_fiteq185.gif)
Figure 39.34: Confidence Ellipse Menu
A confidence ellipse for the population mean is displayed with dashed lines, and a confidence ellipse for prediction is displayed with dotted lines. Figure 39.35 displays a scatter plot with 50% and 80% confidence ellipses for prediction. Use the sliders in the Confidence Ellipses table to change the coefficient of the confidence ellipses.
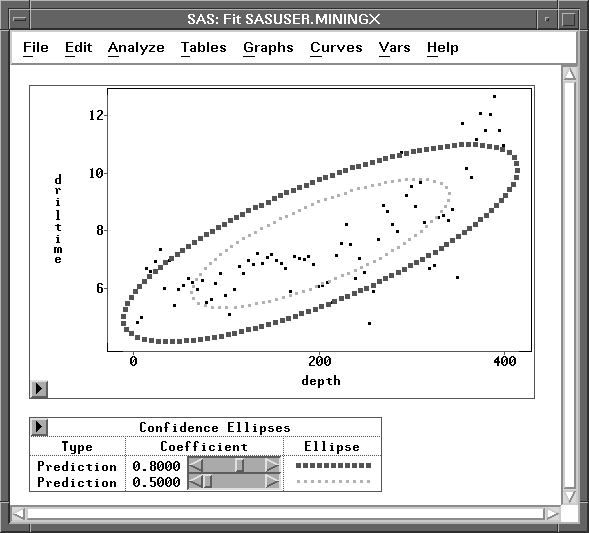
Figure 39.35: Confidence Ellipses for Prediction
Copyright © 2007 by SAS Institute Inc., Cary, NC, USA. All rights reserved.