| Fit Analyses |
C.I. for Parameters
The C.I. for Parameters table gives a confidence interval for each parameter for each confidence coefficient specified. You choose the confidence interval for parameters either in the fit output options dialog or from the Tables menu, as shown in Figure 39.19.
![[menu]](images/fit_fiteq136.gif)
Figure 39.19: C.I. for Parameters Menu
Selecting 95% C.I. / C.I.(Wald) for Parameters or 95% C.I.(LR) for Parameters in the fit output options dialog produces a table with a 95% confidence interval for the parameters. This is the equivalent of choosing Tables:C.I. / C.I.(Wald) for Parameters:95% or Tables:C.I.(LR) for Parameters:95% from the Tables menu. You can also choose other confidence coefficients from the Tables menu. Figure 39.20 illustrates a 95% confidence intervals table for the parameters in a linear model.
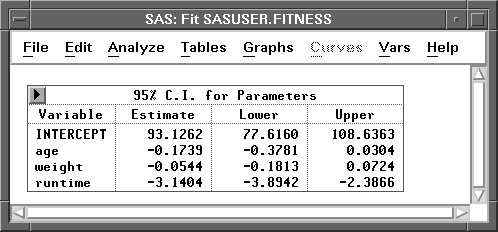
Figure 39.20: C.I. for Parameters Table
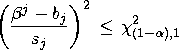
For linear models, a ![]() confidence interval has upper and lower limits
confidence interval has upper and lower limits
For generalized models, you can specify the confidence interval based on either a Wald type statistic or the likelihood function.
A ![]() Wald type confidence interval is constructed from
Wald type confidence interval is constructed from
Thus, ![]() upper and lower limits are
upper and lower limits are
A table of 95% Wald type confidence intervals for the parameters is shown in Figure 39.21.
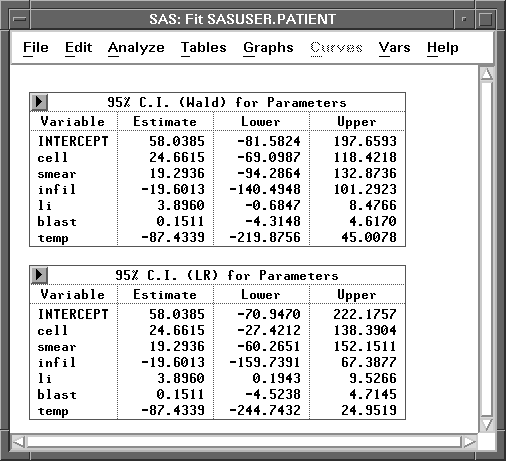
Figure 39.21: C.I. for Parameters Tables
The likelihood ratio test statistic for the null hypothesis
In large samples, the hypothesis is rejected at level ![]() if the test statistic
if the test statistic ![]() is greater than the
is greater than the ![]() critical value of the chi-squared statistic with one degree of freedom.
critical value of the chi-squared statistic with one degree of freedom.
Thus a ![]() likelihood-based confidence interval is constructed using restricted maximization to find upper and lower limits satisfying
likelihood-based confidence interval is constructed using restricted maximization to find upper and lower limits satisfying
An iterative procedure is used to obtain these limits. A 95% likelihood-based confidence interval table for the parameters is illustrated in Figure 39.21.
Copyright © 2007 by SAS Institute Inc., Cary, NC, USA. All rights reserved.