| Fit Analyses |
Summary of Fit for Linear Models
The Summary of Fit table for linear models, shown in Figure 39.11, includes the following:
- Mean of Response
- is the sample mean,
 , of the response variable.
- Root MSE
- is the estimate of the standard deviation of the error term. It is calculated as the square root of the mean square error.
- R-Square
- R2, with values between 0 and 1, indicates the proportion of the (corrected) total variation attributed to the fit.
- Adj R-Sq
- An adjusted R2 is a version of R2 that has been adjusted for degrees of freedom.
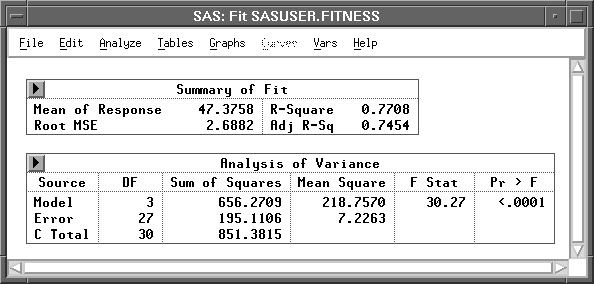
Figure 39.11: Summary of Fit, Analysis of Variance Tables for Linear Models
With an intercept term in the model, R2 is defined as
- R2 = 1-(SSE / CSS)
where
The R2 statistic is also the square of the multiple correlation, that is, the square of the correlation between the response variable and the predicted values.
The adjusted R2 statistic, an alternative to R2, is adjusted for the degrees of freedom of the sums of squares associated with R2. It is calculated as
- Adj R2 = 1-[(SSE / (n-p))/(CSS / (n-1))] = 1-[(n-1)/(n-p)] (1- R2)
Without an intercept term in the model, R2 is defined as
- R2 = 1-(SSE / TSS)
The adjusted R2 statistic is then calculated as
- Adj R2 = 1-[(SSE / (n-p))/(TSS / n)] = 1-[n/(n-p)](1- R2)
Note |
Other definitions of R2 exist for models with no intercept term. Care should be taken to ensure that this is the definition desired. |
Copyright © 2007 by SAS Institute Inc., Cary, NC, USA. All rights reserved.