| Examining Data |
Examining Observations
You can examine selected observations in detail by following these steps. The figures in this section are based on the data being sorted on the NAME variable and the observations selected where POSITION is 13, 1B, or 1O. The previous sections on sorting and finding observations provide examples of how to sort and select.
| Choose Edit:Observations:Examine. |
![[menu]](images/exa_exaeq2.gif)
Figure 3.23: Finding Observations
This displays the Examine Observations dialog. The list on the left shows the observation number for the selected observations: first basemen. The list on the right displays the variable values for the highlighted observation.
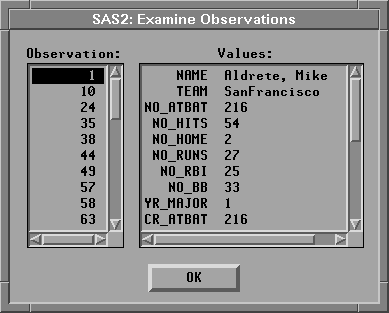
Figure 3.24: Examine Observations Dialog
Scroll down the list on the right to see the rest of Mike Aldrete's statistics. Point and click on observation number 58 to see Will Clark's statistics. Scroll down the list on the left until you can point and click on observation number 246 to see Pete Rose's statistics. Click OK to close the dialog.
You can also use the Examine Observations dialog directly from a graph or chart. To examine observations from a box plot of player salaries, follow these steps.
| Choose Analyze:Box Plot/Mosaic Plot ( Y ). |
This calls up the Box Plot/Mosaic Plot dialog.
![[menu]](images/exa_exaeq3.gif)
Figure 3.25: Creating a Box Plot
| Assign SALARY the Y role and LEAGUE the X role. |
Click on SALARY in the variable list on the left, then click on Y at the top. Similarly, click on LEAGUE in the list on the left, then click on X at the top.
| Click OK to create a box plot of SALARY by LEAGUE. |
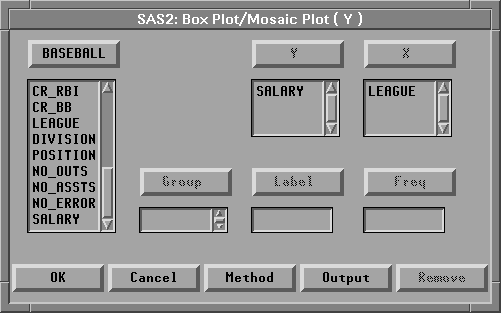
Figure 3.26: Box Plot Variable Roles
| Double-click on the marker representing the highest salary in the National League. |
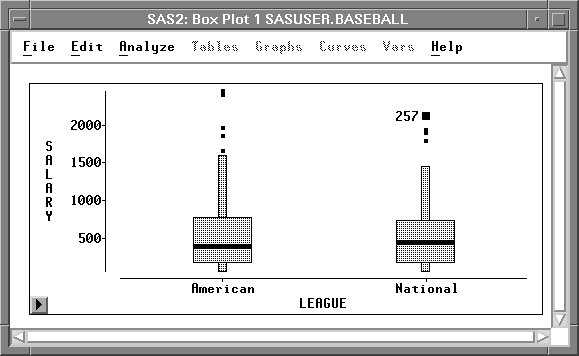
Figure 3.27: Box Plot of SALARY by LEAGUE
Clicking on the observation identifies the point in the graph with its observation number. Double-clicking displays the Examine Observations dialog for the selected observation. In 1986, Mike Schmidt had the highest salary in the National League.
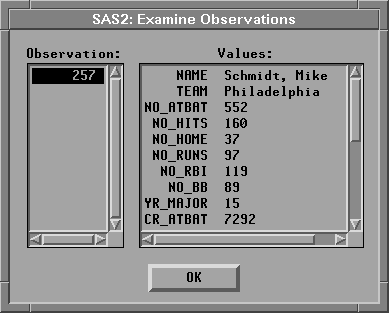
Figure 3.28: Examining Observations
| Double-click on the upper whisker for the American League. |
This displays the values for all observations within the whisker. Then click in the Observation list to see the values for each observation.
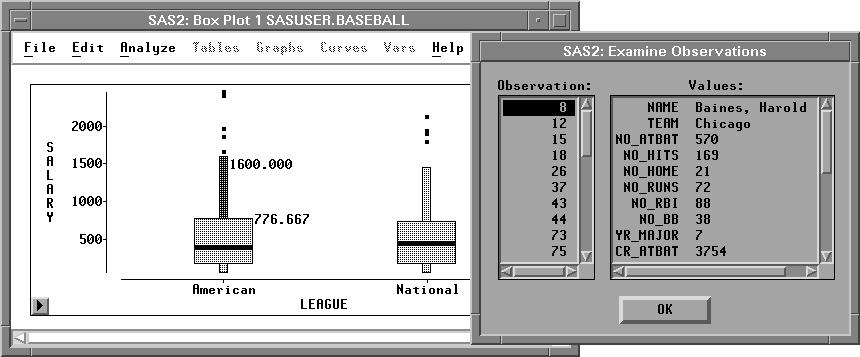
Figure 3.29: Examining Whisker Observations
| Click OK to close the dialog. |
Copyright © 2007 by SAS Institute Inc., Cary, NC, USA. All rights reserved.