| Examining Data |
Sorting Observations
It is often useful to examine data ordered by the values of a variable. Suppose you want to sort the baseball data by players' salaries stored in the SALARY variable. Follow these steps.
| Point and click to select the SALARY variable. |
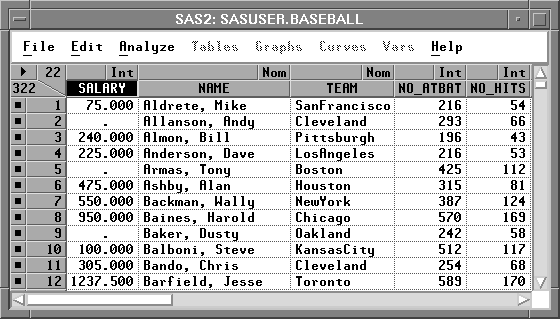
Figure 3.12: Selecting a Variable
| Click on the menu button in the upper left corner. |
This opens the data pop-up menu. Click on Sort.
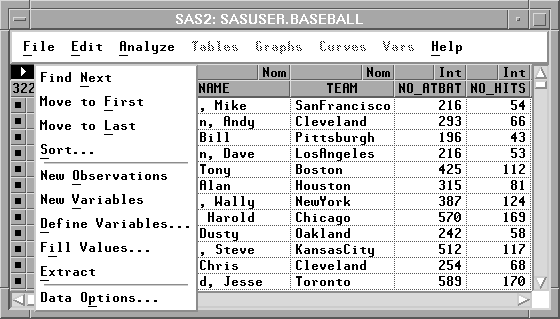
Figure 3.13: Sorting Observations
The data are now sorted by SALARY in ascending order.
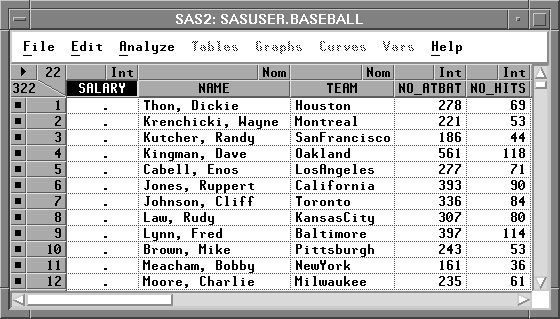
Figure 3.14: Sorted Data
The periods (.) displayed in the observations for SALARY are missing values. Missing values are placeholders that indicate no data are available. Missing values are treated as less than any other value, so when the data are sorted, missing values appear first. If you scroll the data, you can see that the missing values are followed by the smallest salaries.
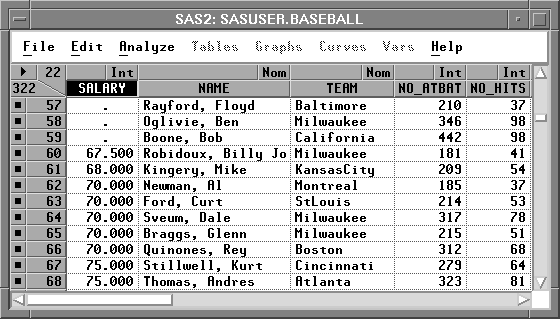
Figure 3.15: Sorted Data, Missing and Nonmissing
Copyright © 2007 by SAS Institute Inc., Cary, NC, USA. All rights reserved.