| Editing Windows |
Aligning Graphs
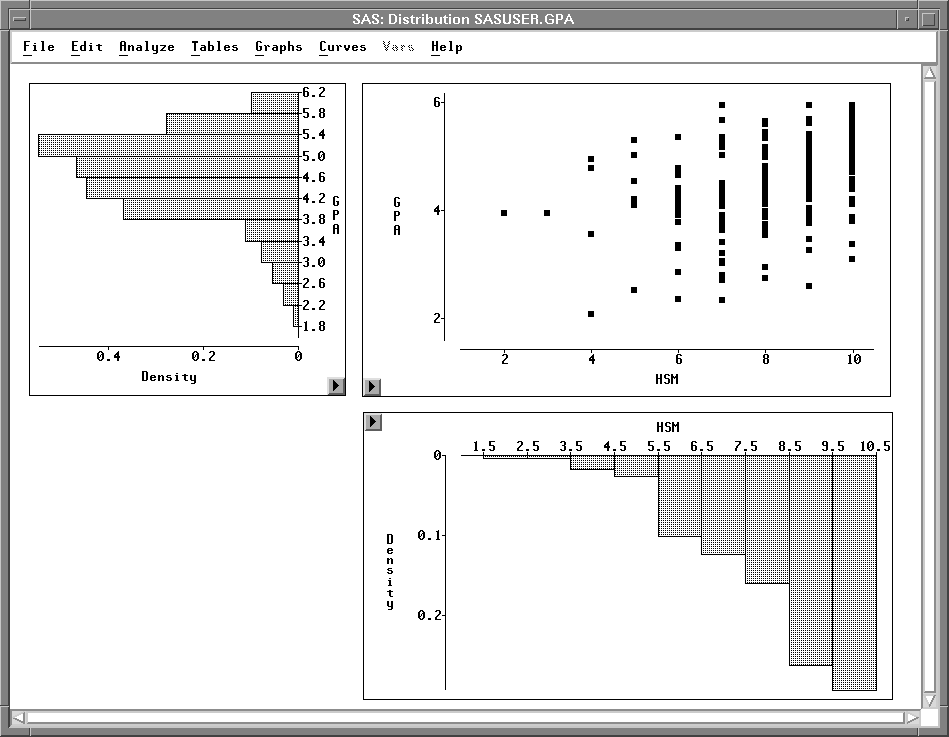
Now that you have created a scatter plot with marginal histograms, you may notice that the axes are not perfectly aligned. For example, the tick label 1.5 in the HSM histogram appears to the right of the tick label 2 in the scatter plot. Similarly, the tick label 6.20 in the GPA histogram appears below the tick label 6.00 in the scatter plot. This occurs because, by default, axes are chosen to maximize the display of the data. You can override this behavior to align axes in different graphs.
| Click once in any empty area to deselect the histogram. |
| Choose Edit:Windows:Align. |
This aligns the HSM and GPA axes in all graphs.
You can align any axes that display the same variable. When you do not want to align all axes in a window, select the axes of interest before choosing Edit:Windows:Align.
Once you have moved, sized, added, deleted, and aligned objects in your windows, you will often want to save and print them. The next three chapters describe how to save and print data, graphs, and tables.
Copyright © 2007 by SAS Institute Inc., Cary, NC, USA. All rights reserved.