| Editing Windows |
Moving and Sizing
Now you have a window containing one scatter plot and two histograms. To make marginal histograms, you should position the graphs so that common axes are parallel.
You can move any graph or table by dragging on its side.
| Drag the HSM histogram below the scatter plot. |
Press the mouse button down on any side of the histogram. Move the mouse to the right. Release the mouse button when you have the histogram positioned below the scatter plot.
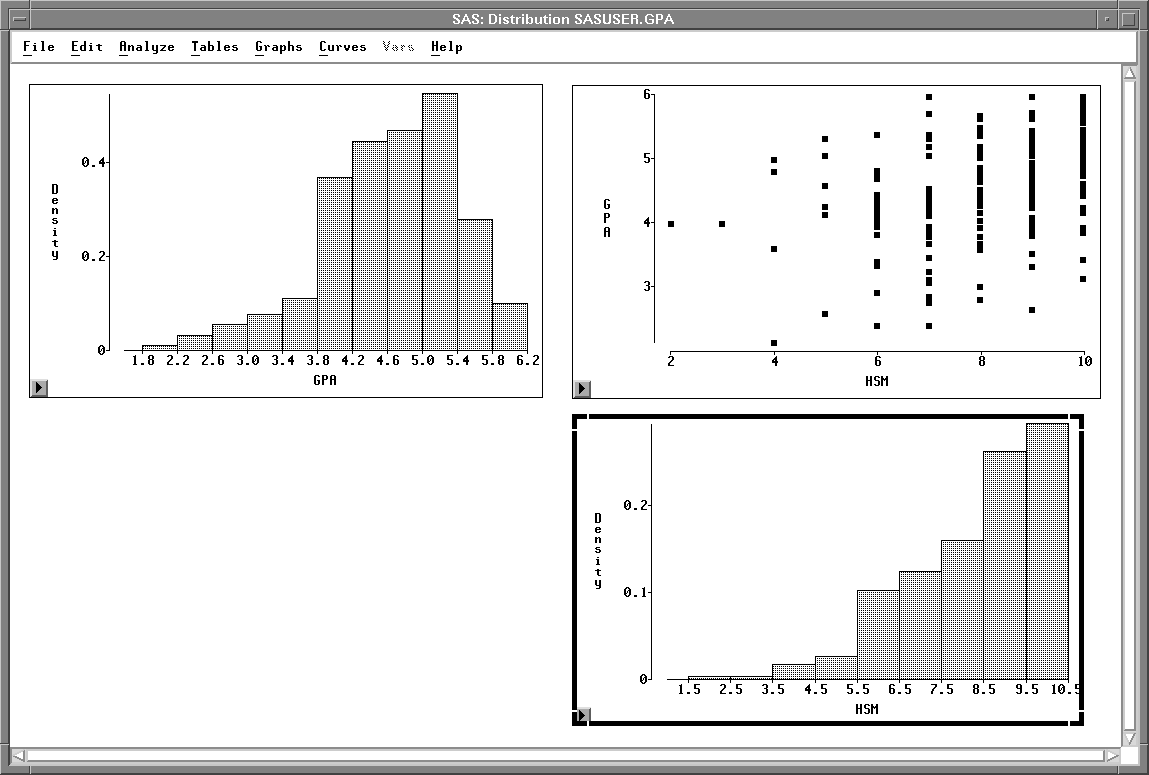
Figure 25.24: Histogram Moved
Now the histogram is in approximately the right place, but it is too large and its orientation is wrong. A marginal histogram should be smaller and the bars should be pointing downward.
You can resize and reorient any graph by dragging on a corner.
| Drag the lower right corner of the HSM histogram upward. |
Press the mouse button down on the lower right corner. Move the mouse upward. Release the mouse button when the histogram is about half its original size.
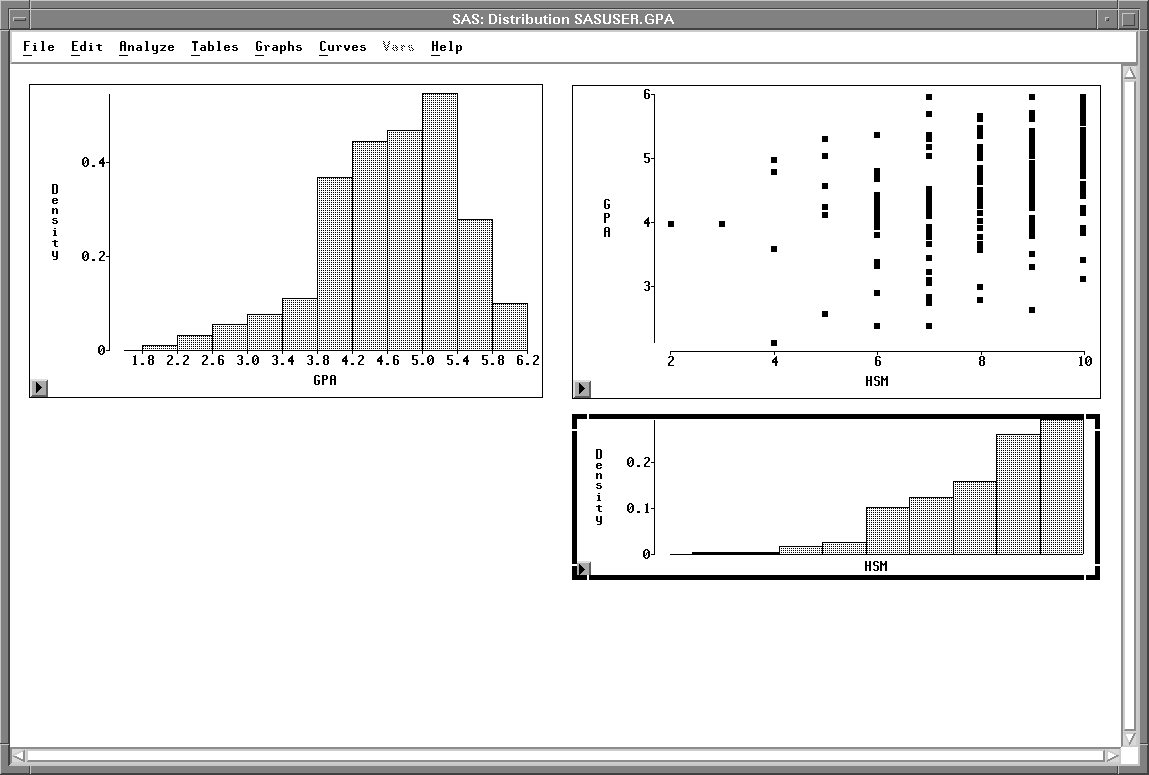
Figure 25.25: Histogram Resized
To change the orientation of the histogram, you can flip it over by dragging one corner across another.
| Drag the upper right corner down past the lower right corner. |
This flips the histogram so that the bars are pointing downward.
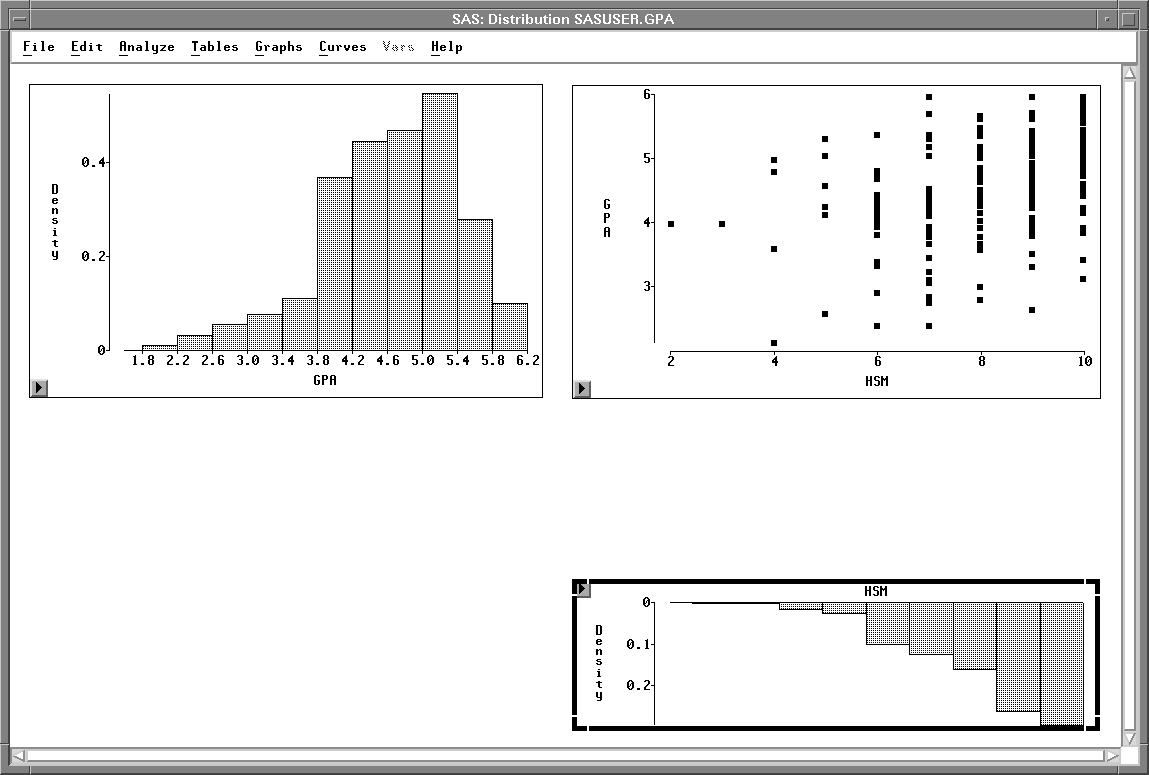
Figure 25.26: Histogram Reoriented
Now you have a scatter plot and one marginal histogram. To orient the other histogram correctly requires two flips.
| Drag the upper left corner of the GPA histogram past the lower right corner. |
This flips the histogram across its diagonal. The bars that were vertical are now horizontal.
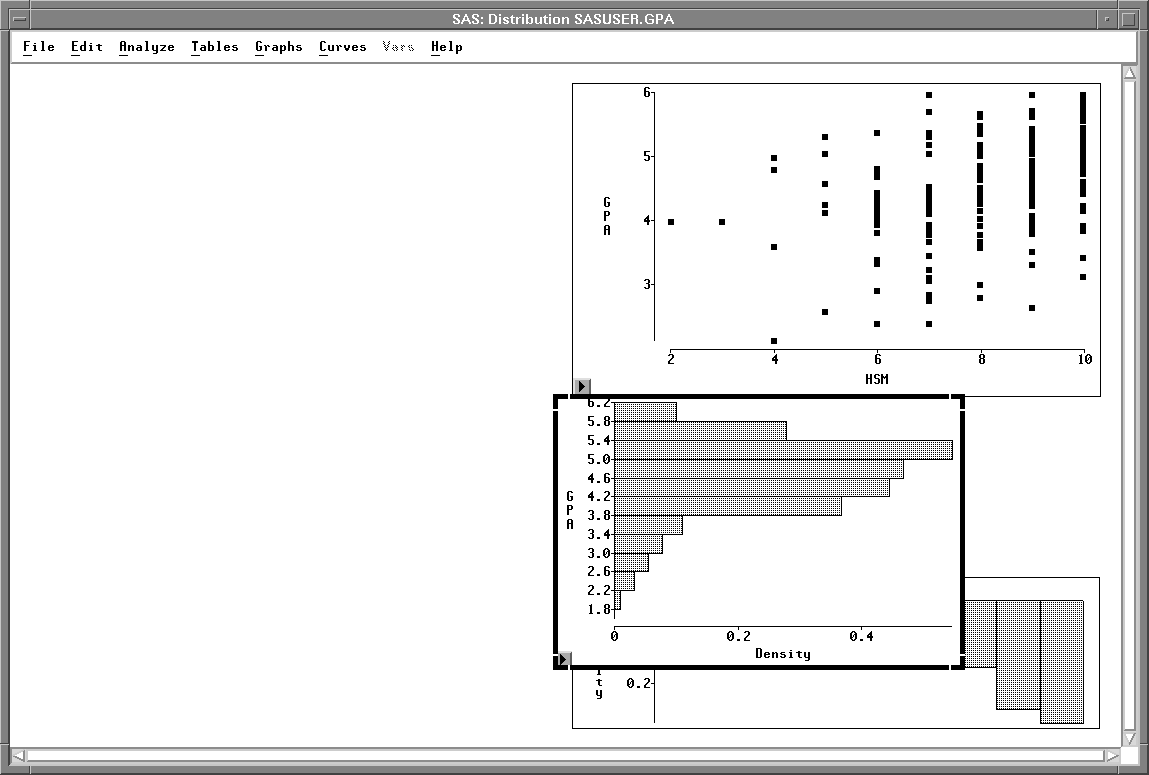
Figure 25.27: Histogram Reoriented
| Drag the upper right corner left past the upper left corner. |
This flips the histogram so that the bars are pointing to the left.
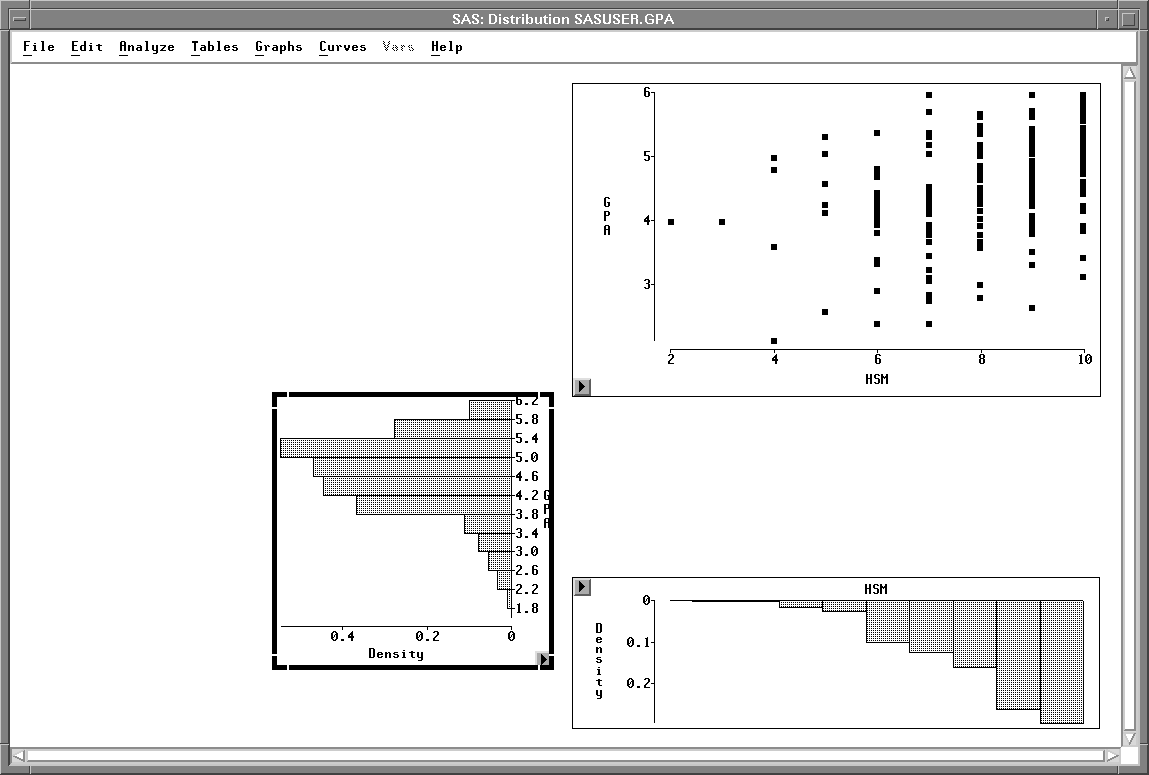
Figure 25.28: Histogram Reoriented
| Size and move both histograms to the margins of the scatter plot. |
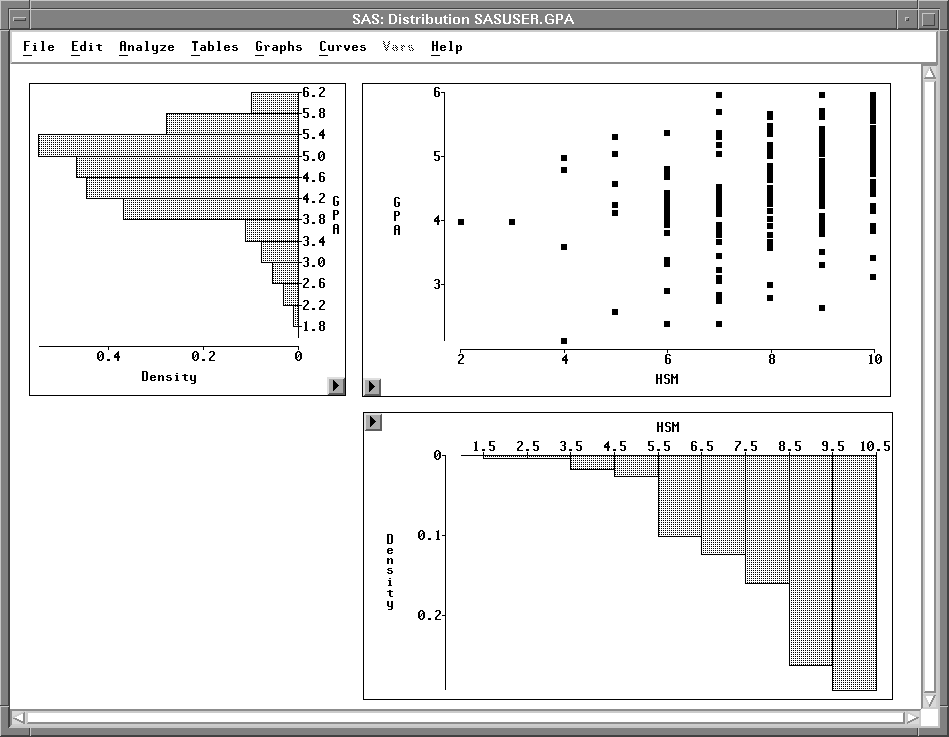
Figure 25.29: Scatter Plot with Marginal Histograms
Now both histograms are correctly oriented and placed at the margins of the scatter plot.
Copyright © 2007 by SAS Institute Inc., Cary, NC, USA. All rights reserved.