| Editing Windows |
Zooming Windows
Zooming a window means adjusting the focus to make objects in the window larger or smaller. Zooming is most useful when you want to see more detail. For example, you may use zooming to explore data in a scatter plot matrix.
| Open the GPA data set. |
This data set contains college grade point averages, high school math, science, and English averages, and SAT scores of first-year college students.
| Select all the variables. |
Click on the variables count in the upper left corner.
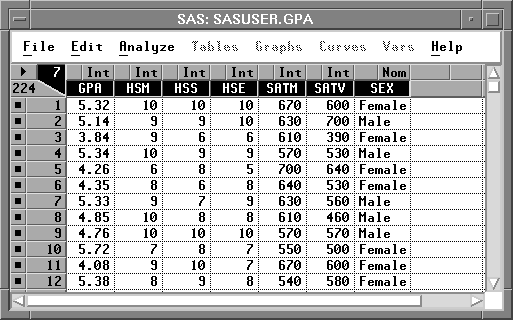
Figure 25.2: Selecting All Variables
| Choose Analyze:Scatter Plot ( Y X ). |
This creates a seven-by-seven scatter plot matrix.
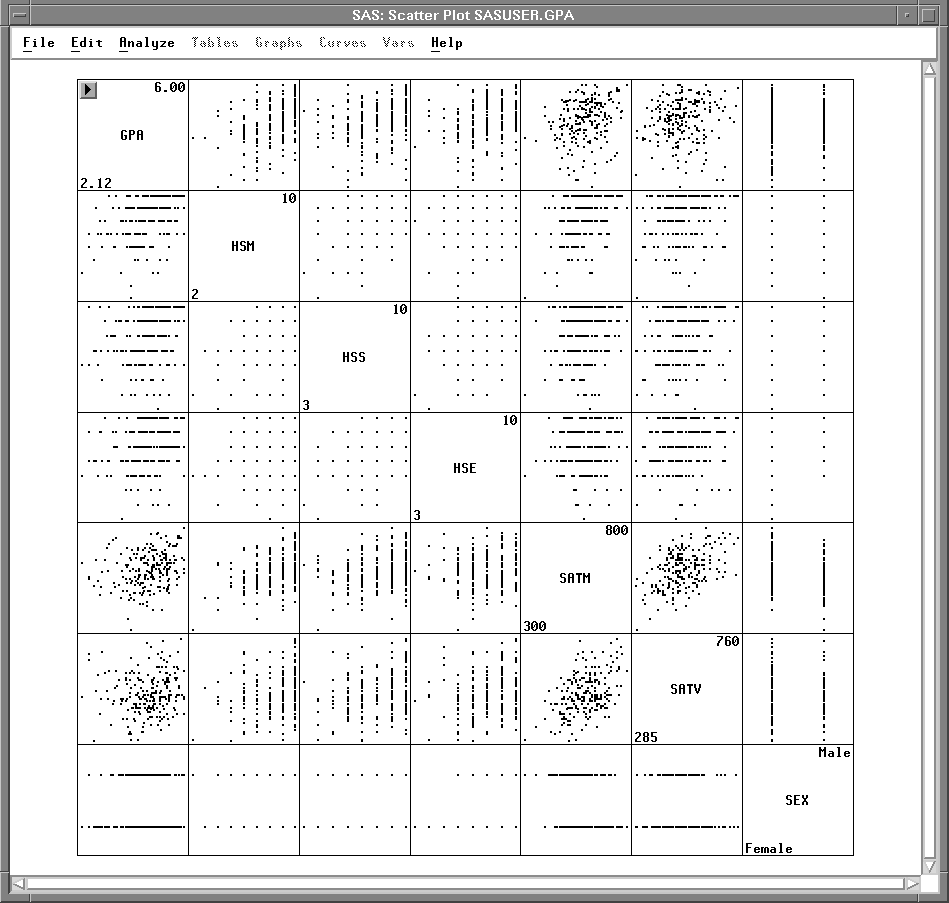
Figure 25.3: Scatter Plot Matrix
Some of these plots show interesting patterns. However, it is difficult to see the plots when they are so small. To change the size of the plots, follow these steps.
| Choose Edit:Windows:Tools. |
![[menu]](images/edw_edweq1.gif)
Figure 25.4: Edit:Windows Menu
This displays the Tools window. At the top, the window contains three tools, each indicating a different mode of operation. To select and identify objects, use the arrow. To manipulate objects, use the hand. To zoom, use the magnifying glass.
| Click on the magnifying glass in the Tools window. |
Now the magnifying glass in the window is highlighted, and the cursor changes from an arrow to a magnifying glass.
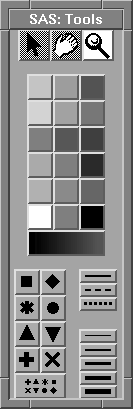
Figure 25.5: Tools Window
| Move the magnifying glass to the center of the window and click several times. |
When it is near the center of the window, the magnifying glass is large.
Clicking near the center makes objects larger.
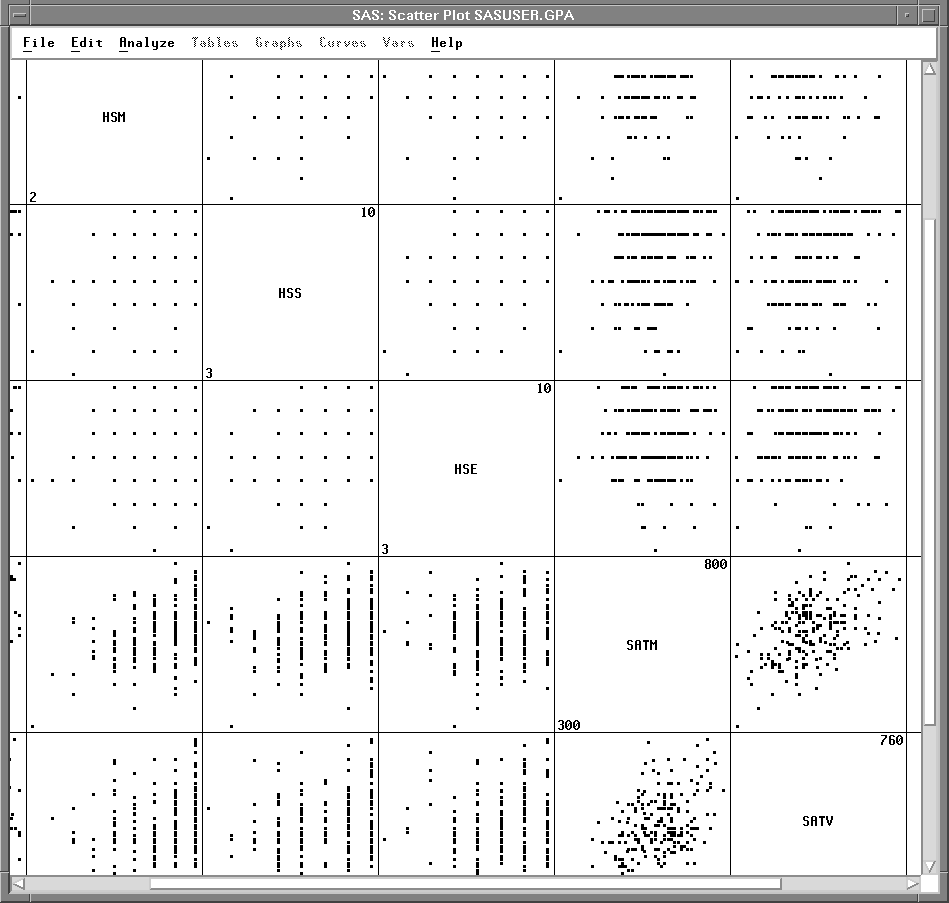
Figure 25.6: Zooming In
| Move the magnifying glass to the edge of the window and click several times. |
When it is near the edge of the window, the magnifying glass is small.
Clicking near the edge makes objects smaller until all objects fit in the window.

Figure 25.7: Zooming Out
| Click several times between the center and the edge of the window. |
The degree of magnification is proportional to the distance of your cursor from the center or the edge of the window. Clicking between the center and the edge makes fine adjustments. By clicking in this area, you can give the plots exactly the size you want.
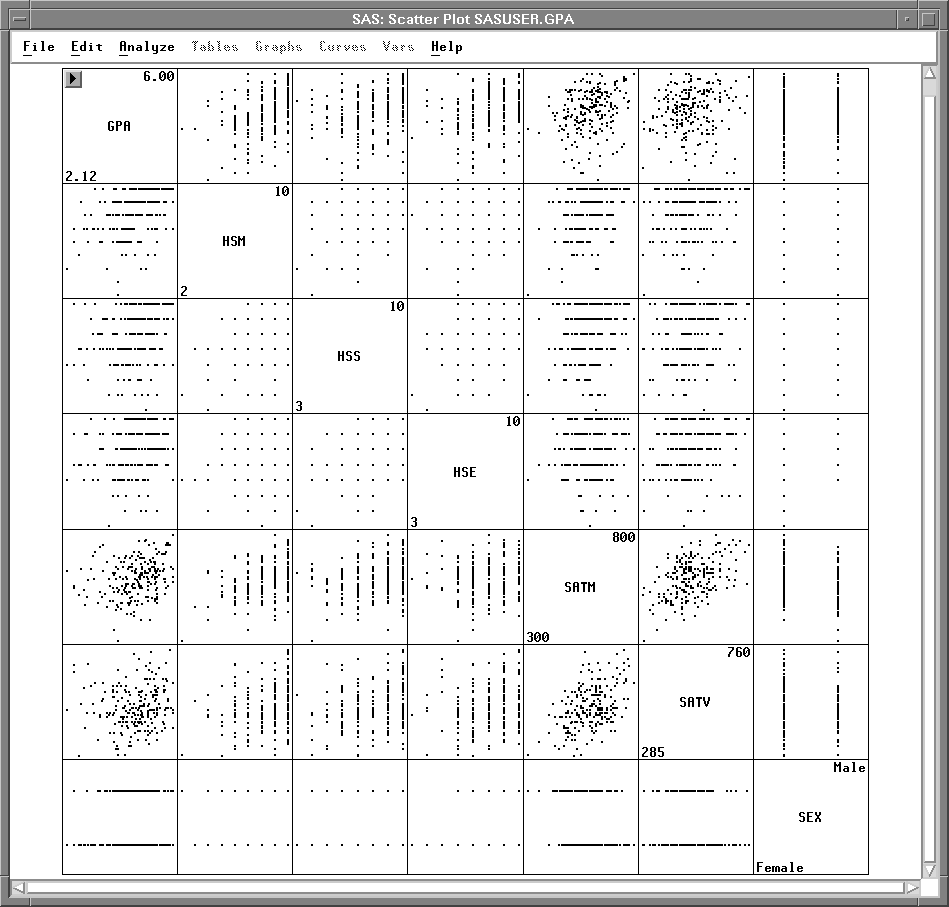
Figure 25.8: Making Fine Adjustments
To zoom in on a specific area, you can drag a rectangle with the magnifying glass.
| Drag a rectangle around the plot of GPA versus HSM. |
On some hosts, to drag a rectangle it is necessary to begin moving the mouse as soon as you depress the mouse button.
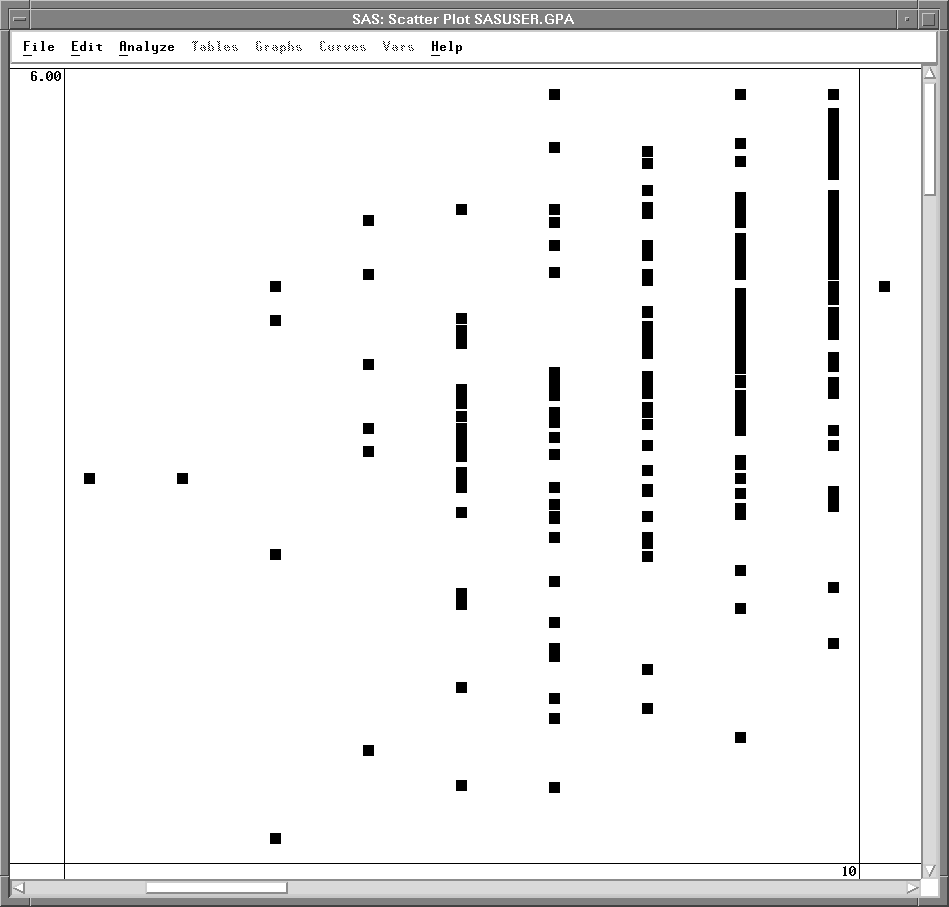
Figure 25.9: Zooming in on GPA versus HSM
You can restore the original size of the plots by clicking repeatedly near the edge of the window. If you prefer, instead of clicking repeatedly, you can press the mouse button down and hold it down. On most hosts, holding has the same effect as repeated clicks.
When you have zoomed in far, you may find it easier to Renew the window, as described in the next section.
Copyright © 2007 by SAS Institute Inc., Cary, NC, USA. All rights reserved.