| Distribution Analyses |
Test for Distribution
You can test that the data are from a specific family of distributions, such as the normal, lognormal, exponential, or Weibull distributions. You do not need to specify the distribution parameters except the threshold parameters for the lognormal, exponential, and Weibull distributions. The Kolmogorov statistic assesses the discrepancy between the empirical distribution and the estimated hypothesized distribution F.
For a test of normality, the hypothesized distribution is a normal distribution function with parameters ![]() and
and ![]() estimated by the sample mean and standard deviation. The probability of a larger test statistic is obtained by linear interpolation within the range of simulated critical values given by Stephens (1974).
estimated by the sample mean and standard deviation. The probability of a larger test statistic is obtained by linear interpolation within the range of simulated critical values given by Stephens (1974).
For a test of whether the data are from a lognormal distribution, the hypothesized distribution is a lognormal distribution function with a given parameter ![]() and parameters
and parameters ![]() and
and ![]() estimated from the sample after the logarithmic transformation of the data,
estimated from the sample after the logarithmic transformation of the data, ![]() .The sample mean and standard deviation of the transformed sample are used as the parameter estimates. The test is therefore equivalent to the test of normality on the transformed sample.
.The sample mean and standard deviation of the transformed sample are used as the parameter estimates. The test is therefore equivalent to the test of normality on the transformed sample.
For a test of exponentiality, the hypothesized distribution is an exponential distribution function with a given parameter ![]() and a parameter
and a parameter ![]() estimated by
estimated by ![]() .The probability of a larger test statistic is obtained by linear interpolation within the range of simulated critical values given by Stephens (1974).
.The probability of a larger test statistic is obtained by linear interpolation within the range of simulated critical values given by Stephens (1974).
For a test of whether the data are from a Weibull distribution, the hypothesized distribution is a Weibull distribution function with a given parameter ![]() and parameters c and
and parameters c and ![]() estimated by the maximum-likelihood method. The probability of a larger test statistic is obtained by linear interpolation within the range of simulated critical values given by Chandra, Singpurwalla, and Stephens (1981).
estimated by the maximum-likelihood method. The probability of a larger test statistic is obtained by linear interpolation within the range of simulated critical values given by Chandra, Singpurwalla, and Stephens (1981).
You specify the distribution in the cumulative distribution options dialog or in the Test for Distribution dialog after choosing Curves:Test for Distribution from the menu, as shown in Figure 38.33. You can also specify a threshold parameter other than zero for lognormal, exponential, and Weibull distributions.
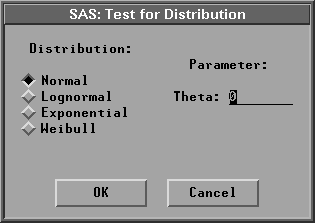
Figure 38.33: Test for Distribution Dialog
The default tests that the data are from a normal distribution. A test for normality and a test for lognormal distribution with ![]() = 30 are given in Figure 38.34. You can use the Mean/Theta slider to adjust the threshold parameter,
= 30 are given in Figure 38.34. You can use the Mean/Theta slider to adjust the threshold parameter, ![]() , for lognormal, exponential, and Weibull distributions.
, for lognormal, exponential, and Weibull distributions.
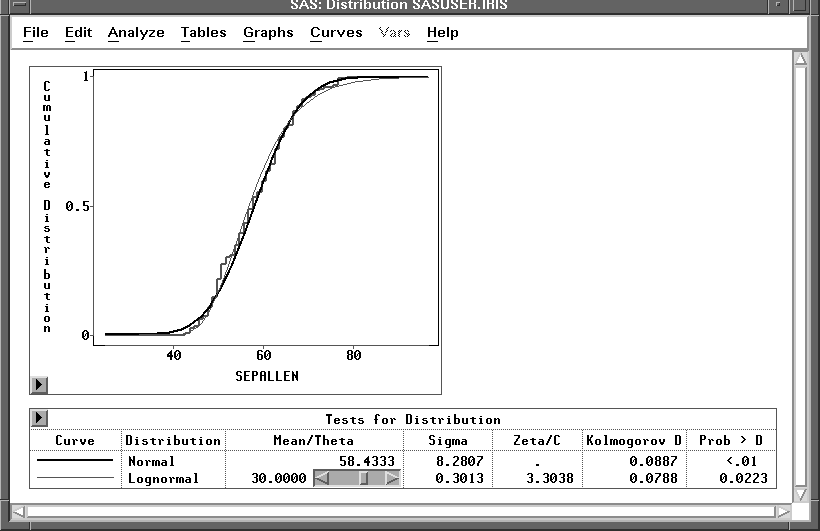
Figure 38.34: Tests for Distribution
Copyright © 2007 by SAS Institute Inc., Cary, NC, USA. All rights reserved.