| Distribution Analyses |
Parametric CDF
You can fit the normal, lognormal, exponential, and Weibull distributions to your data. You specify the family of distributions either in the cumulative distribution options dialog or from the Parametric CDF Estimation dialog after choosing Curves:Parametric CDF from the menu.
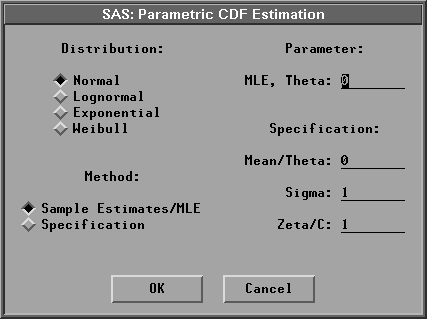
Figure 38.29: Parametric CDF Dialog
For the normal distribution, you can specify your own ![]() and
and ![]() parameters from the Fit Parametric menu. Otherwise, you can use the sample mean and standard deviation as estimates for
parameters from the Fit Parametric menu. Otherwise, you can use the sample mean and standard deviation as estimates for ![]() and
and ![]() by selecting Fit Parametric:Normal in the cumulative distribution options dialog or by choosing Distribution:Normal and Method:Sample Estimates/MLE in the Parametric CDF Estimation dialog.
by selecting Fit Parametric:Normal in the cumulative distribution options dialog or by choosing Distribution:Normal and Method:Sample Estimates/MLE in the Parametric CDF Estimation dialog.
For the lognormal, exponential, and Weibull distributions, you can specify your own threshold parameter ![]() and have the remaining parameters estimated by the maximum- likelihood method, or you can specify all the distribution parameters in the Parametric CDF Estimation dialog. Otherwise, you can have the threshold parameter set to 0 and the remaining parameters estimated by the maximum-likelihood method. To do this, select Lognormal, Exponential, or Weibull in the Cumulative Distribution Output dialog or choose Method:Sample Estimates/MLE and Parameter:MLE, Theta:0 in the Parametric CDF Estimation dialog.
and have the remaining parameters estimated by the maximum- likelihood method, or you can specify all the distribution parameters in the Parametric CDF Estimation dialog. Otherwise, you can have the threshold parameter set to 0 and the remaining parameters estimated by the maximum-likelihood method. To do this, select Lognormal, Exponential, or Weibull in the Cumulative Distribution Output dialog or choose Method:Sample Estimates/MLE and Parameter:MLE, Theta:0 in the Parametric CDF Estimation dialog.
If you select a Weight variable, only normal CDF can be created. For Method:Sample Estimates/MLE, ![]() and sw are used to display the cumulative distribution function with vardef=WDF/WGT;
and sw are used to display the cumulative distribution function with vardef=WDF/WGT; ![]() and sa are used with vardef=DF/N. For Method:Specification, the values in the entry fields Mean/Theta and Sigma are used to display the cumulative distribution function with vardef=WDF/WGT; the values of Mean/Theta and Sigma/
and sa are used with vardef=DF/N. For Method:Specification, the values in the entry fields Mean/Theta and Sigma are used to display the cumulative distribution function with vardef=WDF/WGT; the values of Mean/Theta and Sigma/![]() are used with vardef=DF/N.
are used with vardef=DF/N.
Figure 38.30 displays a normal distribution function with ![]() = 58.4333 (the sample mean) and
= 58.4333 (the sample mean) and ![]() = 8.2807 (the sample standard deviation); it also displays a lognormal distribution function with
= 8.2807 (the sample standard deviation); it also displays a lognormal distribution function with ![]() = 30 and
= 30 and ![]() and
and ![]() estimated by the MLE.
estimated by the MLE.
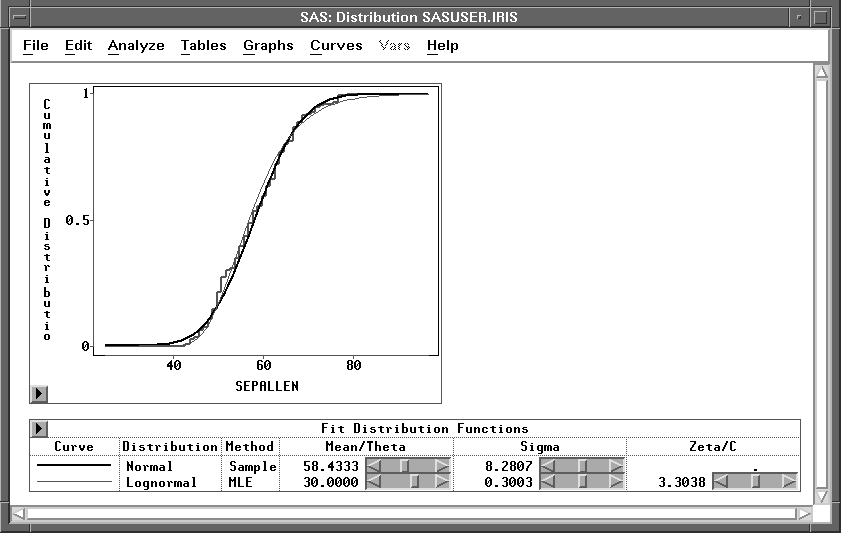
Figure 38.30: Parametric CDF
Use sliders to change the CDF estimate. When MLE is used for the lognormal, exponential, and Weibull distributions, changing the value of ![]() in the slider also causes the remaining parameters to be estimated by the MLE for the new
in the slider also causes the remaining parameters to be estimated by the MLE for the new ![]() .
.
Copyright © 2007 by SAS Institute Inc., Cary, NC, USA. All rights reserved.