| Fitting Curves |
Normal Kernel Fit
To add a normal kernel estimate in the MININGX fit window from the preceding section, follow these steps.
| Choose Curves:Kernel. |
This displays the kernel fit dialog, as shown in Figure 13.14.
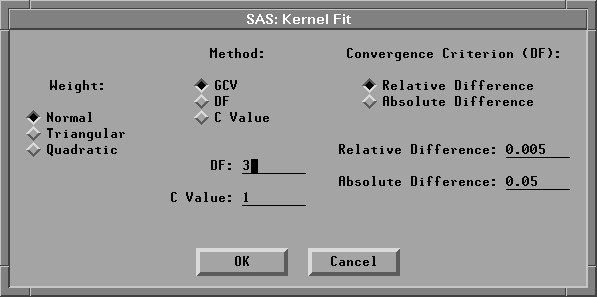
Figure 13.14: Kernel Fit Dialog
| Click on OK in the dialog to display the kernel fit, as shown in Figure 13.15. |
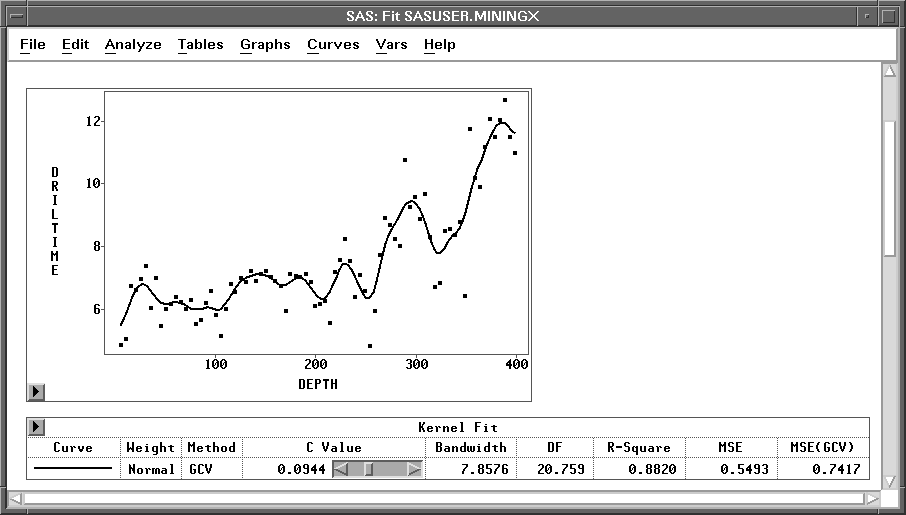
Figure 13.15: Normal Kernel Fit
By default, the optimal kernel smoothness is estimated based on mean square error using generalized cross validation (GCV). Cross validation leaves out points (xi, yi) one at a time and computes the kernel regression at xi based on the remaining n-1 observations. Generalized cross validation is a weighted version of cross validation and is easier to compute. This estimation is carried out for a number of different values of the smoothing parameter, and the value that minimizes the estimated mean square error is selected (Hastie and Tibshirani 1990). This technique is described in detail in Chapter 39, "Fit Analyses." Note that in Figure 13.15, the Kernel Fit table shows the Method as GCV.
You can change the degree of smoothness by using the slider in the Kernel Fit table to change the value of c. Higher values of c result in smoother curves closer to a straight line; smaller values produce more flexible curves. It is often necessary to experiment with several values before finding one that fits your data well. See Chapter 39, "Fit Analyses," for detailed information about kernels and the c parameter. Note that if you use the slider to change the value of c, the Method entry also changes.
The Kernel Fit table contains several statistics for comparing the kernel fit to other fits. The table contains the bandwidth or smoothing parameter of the kernel that corresponds to the value of c. The column labeled DF gives the approximate degrees of freedom for the kernel fit. Smoother curves have fewer degrees of freedom and result in lower values of R2 and possibly higher values of mean square error. R-square measures the proportion of the total variation accounted for by the kernel fit. MSE(GCV) is an estimate of the mean square error using generalized cross validation. These statistics are also discussed in Chapter 39, "Fit Analyses."
This kernel tracks the data fairly well. The fit requires 20.759 degrees of freedom, indicating that the model may still be under-smoothed. The generalized cross validation method often results in under-smoothed fits, particularly with small data sets (Hastie and Tibshirani 1990). In this case, the data were collected from a single drilling hole, and this can lead to spurious cyclical patterns in the data caused by autocorrelation. The curve may be tracking these cycles. A smoother fit is probably desirable.
| Click three times on the right arrow in the slider. |
This results in a smoother kernel fit, as shown in Figure 13.16.

Figure 13.16: Normal Kernel Fit Made Smoother
Copyright © 2007 by SAS Institute Inc., Cary, NC, USA. All rights reserved.