| Examining Correlations |
Creating the Analysis
The GPA data set contains information collected to determine which applicants at a university were likely to succeed in its computer science program. The variable GPA is the grade point average; HSM, HSS, and HSE are average high school grades in mathematics, science, and English; and SATM and SATV are scores on the mathematics and verbal portion of the SAT exam (Moore and McCabe 1989).
Follow these steps to create a correlation analysis of the GPA data.
| Open the GPA data set. |
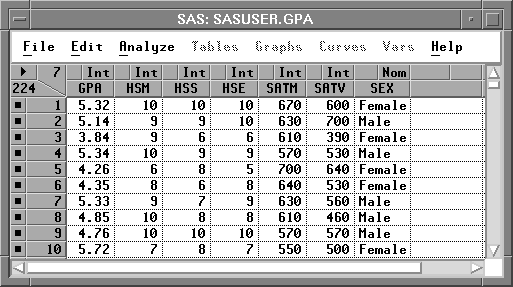
Figure 18.2: GPA Data
| Choose Analyze:Multivariate ( Y's ). |
![[menu]](images/cor_coreq1.gif)
| Select GPA, HSM, HSS, HSE, SATM, and SATV. Then click the Y button to assign these variables the Y role. |
Your variables dialog should now appear, as shown in Figure 18.4.
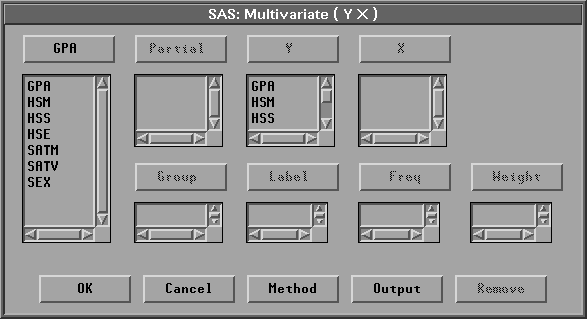
Figure 18.4: Multivariate Variables Dialog
| Click OK to create the multivariate window. |
By default, the multivariate window contains tables of Univariate Statistics and the Correlation Matrix.
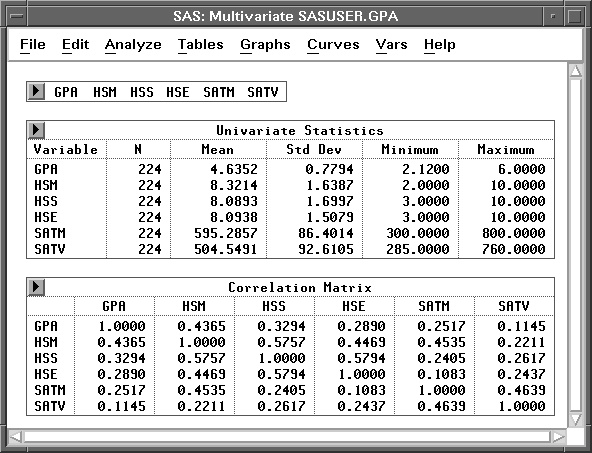
Figure 18.5: Multivariate Window
Correlation Matrix
Confidence Ellipses
Copyright © 2007 by SAS Institute Inc., Cary, NC, USA. All rights reserved.