| Analysis of Variance |
Summary of Fit
The Summary of Fit table, as shown in Figure 15.7, contains summary statistics. The Mean of Response 19.1667 is the overall mean of CHANG_BP. The Root MSE 9.7886 is the square root of the mean square error given in the Analysis of Variance table. Root MSE is an estimate of ![]() in the preceding analysis of variance model.
in the preceding analysis of variance model.
The R-Square value is 0.5250, which means that 52% of the variation in CHANG_BP is explained by the fitted model. Adj R-Sq is an alternative to R-Square, adjusted for the number of parameters in the model.
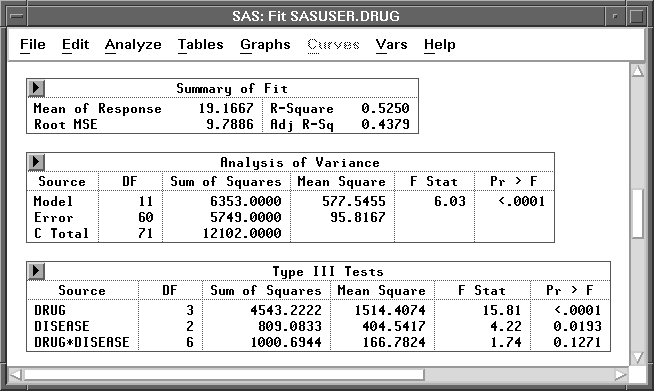
Figure 15.7: Fit Window - Summary of Fit
Copyright © 2007 by SAS Institute Inc., Cary, NC, USA. All rights reserved.