The MVPDIAGNOSE Procedure

Example 11.1 Phase II Analysis with MVPDIAGNOSE
The example in Getting Started: MVPDIAGNOSE Procedure illustrates how you build a principal component model and apply the MVPMONITOR and MVPDIAGNOSE procedures to perform a Phase I analysis. In Phase I analysis you analyze the data that were used to build the principal component model. This example is a continuation of that example and illustrates how you can use PROC MVPDIAGNOSE to analyze process data that were not used to build the model. This is called a Phase II analysis. A Phase II analysis is usually performed on data that are collected after the data that are used to build the model.
In the original example the principal component model was built using flight delay data from February 1–16, 2007. The following
statements create a data set named MWflightDelays2 that contains average delays for flights that originated in the midwestern United States on February 17–28, 2007:
data MWflightDelays2;
   label flightDate='Date';
   format flightDate MMDDYY8.;
   input flightDate :MMDDYY8. AA CO DL F9 FL NW UA US WN;
   dayofweek = put(flightDate,downame.);
   datalines;
02/17/07 25.6  7.8 15.5 13.4 16.1 16.2 23.0 24.2  8.2
02/18/07  5.4 16.0  9.9  1.1 11.5 17.0 15.6 15.5  5.1
02/19/07 13.2 16.3 10.0 10.6  5.4 10.3  9.5 16.8  9.3
02/20/07  4.2  6.9  1.4  0.1  7.2  6.6  7.4 10.4  2.9
02/21/07  5.4 -0.1  7.4  8.7 16.3 24.3  9.4  6.0 10.2
02/22/07 19.6 30.2  6.8  2.7  8.9 16.4 14.3 12.6  8.2
02/23/07 14.9 18.9  9.9  9.1 12.0 16.5 17.4 12.8  6.0
02/24/07 21.4  5.5 11.1 46.1 10.6 55.3 22.9  8.8  3.4
02/25/07 42.6  7.7 14.6 14.4 32.0 50.7 46.1 49.4 39.1
02/26/07 43.2 25.1 18.1 18.2 28.8 31.1 38.6 29.6 18.6
02/27/07 11.3 17.1  5.3  4.1  4.8 13.9  9.8  9.7  7.1
02/28/07  8.1  3.7  2.7 17.1 -0.8  5.5 11.0 14.3  3.1
;
The dayofweek variable contains the day of the week for each date in the input data set. The following statements apply the model that
is saved in the mvpairloadings data set to the flightDelays2 data and produce a score plot for the first two principal components:
proc mvpdiagnose data=MWflightDelays2 loadings=mvpairloadings;
   id flightDate;
   scoreplot / labels=on group=dayofweek;
   label dayofweek='';
run;
The ID
statement labels the points in the score plot with flightDate variable values. The GROUP=
option displays the observations grouped by day of the week. The LABEL statement suppresses the GROUP= legend label. Output 11.1.1 shows the score plot.
Output 11.1.1: Score Plot with Observations Grouped by Day of the Week
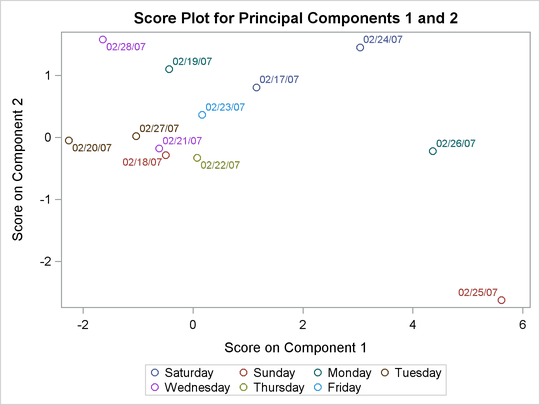
The Saturday and Sunday observations seem to be divided by scores for principal component 1. The following statements modify
the dayofweek values to merge the observations for the other days into a "weekday" group:
data MWflightDelays2;
   set MWflightDelays2;
   weekday = put(flightDate,weekday.);
   if not ( weekday in (1 7) ) then dayofweek='weekday';
run;
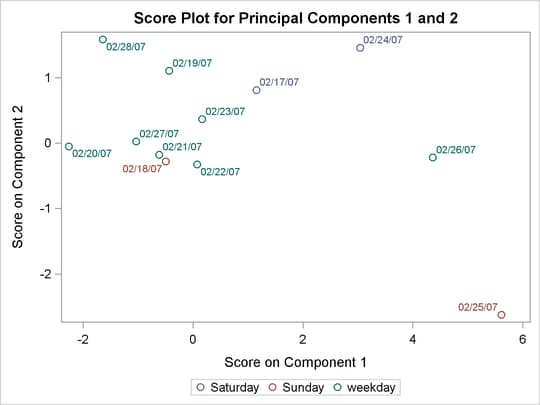
Output 11.1.2 shows the score plot that is produced by running PROC MVPDIAGNOSE with this new grouping. Merging the weekday observations into a single group emphasizes the Saturday and Sunday scores.
Output 11.1.2: Score Plot with Alternate Grouping
Because the score plot shows that something interesting might be happening on the weekends, you might want to examine contribution
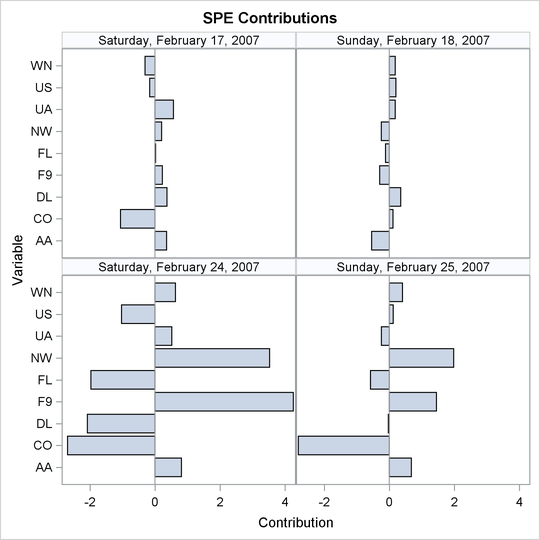
plots for those days. The following statements produce paneled  and SPE contribution plots for the weekend observations:
proc mvpdiagnose data=MWflightDelays2 loadings=mvpairloadings;
   where dayofweek ne 'weekday';
   time flightDate;
   contributionpanel;
   contributionpanel / type=spe;
   format flightDate weekdate.;
run;
Because the CONTRIBUTIONPANEL statement produces contribution plots for a series of observations starting with the first observation in the input data set, it is convenient to use a WHERE statement to select observations of interest.
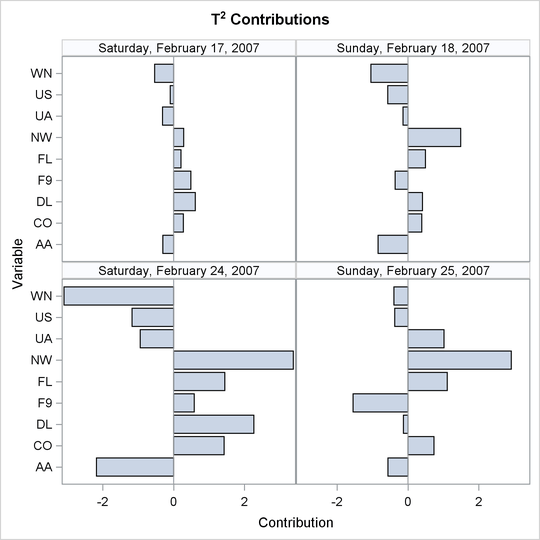
Output 11.1.3 and Output 11.1.4 show the paneled contribution plots.
Output 11.1.3: Contribution Plots for Weekends
Output 11.1.4: SPE Contribution Plots for Weekends