The ISHIKAWA Procedure
Overview
The Ishikawa diagram,[18] also known as a cause-and-effect diagram or fishbone diagram, is one of the seven basic tools for quality improvement in Japanese industry. It is used to display the factors that affect a particular quality characteristic or problem. For example, the following Ishikawa diagram shows factors affecting the quality of air travel service:
Figure 8.1: Ishikawa Diagram
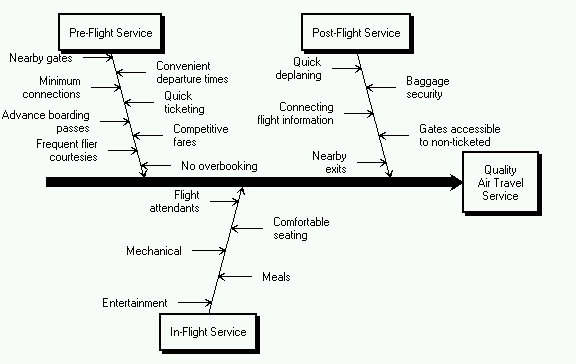
In this example, the factors are organized into three categories of service (Pre-flight, In-flight, and Post-flight), which are represented as branches. The factors affecting each of these areas are represented as stems.
An Ishikawa diagram is typically the result of a brainstorming session to improve a product, process, or service. The main goal is represented by a main arrow or trunk, and primary factors are represented as sub-arrows or branches. Secondary factors are then added as stems, tertiary factors as leaves, and so on.
Creating the diagram stimulates discussion and often leads to an increased understanding of a complex problem. Japanese QC Circle members often post Ishikawa diagrams in a display area where they will be accessible to managers and other groups; refer to Rodriguez (1991). In the United States, Ishikawa diagrams are often included in presentations by plant personnel to management or customers.
Traditionally, Ishikawa diagrams have been prepared by hand on paper or chalk boards. This limits the amount of detail that can be added and makes it awkward to update the diagram as an understanding of the process evolves. Manual preparation also restricts the collection and display of data on the diagram, as advocated by Ishikawa (1982).
The ISHIKAWA procedure was designed to overcome these limitations by providing a highly interactive graphics environment (referred to in this section as the ISHIKAWA environment) for creating and modifying Ishikawa diagrams.
In the ISHIKAWA environment you can
-
add and delete arrows with a mouse. You can also swap, copy, and so forth.
-
highlight special problems or critical paths with line styles and color
-
display additional data for each of the arrows in a popup notepad
-
display portions of the diagram in separate windows for increasing or isolating detail. You can also divide sections of the diagram into separate Ishikawa diagrams.
-
merge multiple Ishikawa diagrams into a single, master diagram
-
display any number of arrows and up to ten levels of detail
-
foliate and defoliate diagrams dynamically
-
save diagrams for future editing
-
save diagrams in graphics catalogs or export them to host clipboards or graphics files
-
customize graphical features such as fonts, arrow types, and box styles
-
obtain online help at any time
If you are using the ISHIKAWA procedure for the first time, the tutorial at the end of this chapter demonstrates some of the basic operations used in the ISHIKAWA procedure. A summary of these operations (and others) can be found in the section Summary of Operations.
For a detailed discussion of each of the operations, see Details of the ISHIKAWA Environment. This chapter includes many tools not presented in the tutorial.