Measurement Systems Analysis

Example A.3 Gauge R&R for Gasket Thickness
This example is patterned after an example given in ASQC Automotive Division/AIAG (1990).
Suppose the ABC Company needs to evaluate a gasket thickness gauge. Three operators (George, Jane, and Robert) are selected
for this study. Using the same gauge, each operator measures ten parts (gaskets) in a random order. Each part is measured
by each operator twice (two trials). The following statements create a data set called ABC that contains the measurements (gasket thicknesses) collected by each operator.
data ABC;
   input Operator $ Sample @;
   do i=1 to 2;
      input Trial @;
      output;
   end;
   datalines;
George    1   0.65  0.60
George    2   1.00  1.00
George    3   0.85  0.80
George    4   0.85  0.95
George    5   0.55  0.45
George    6   1.00  1.00
George    7   0.95  0.95
George    8   0.85  0.80
George    9   1.00  1.00
George   10   0.60  0.70
Jane      1   0.55  0.55
Jane      2   1.05  0.95
Jane      3   0.80  0.75
Jane      4   0.80  0.75
Jane      5   0.40  0.40
Jane      6   1.00  1.05
Jane      7   0.95  0.90
Jane      8   0.75  0.70
Jane      9   1.00  0.95
Jane     10   0.55  0.50
Robert    1   0.50  0.55
Robert    2   1.05  1.00
Robert    3   0.80  0.80
Robert    4   0.80  0.80
Robert    5   0.45  0.50
Robert    6   1.00  1.05
Robert    7   0.95  0.95
Robert    8   0.80  0.80
Robert    9   1.05  1.05
Robert   10   0.85  0.80
;
You can use the %msagrr macro to perform the analysis:
%msagrr(ABC, condition=Operator, value=Trial);
The average and range chart is shown is Output A.3.1.
Output A.3.1: Gasket Thickness Average and Range Charts
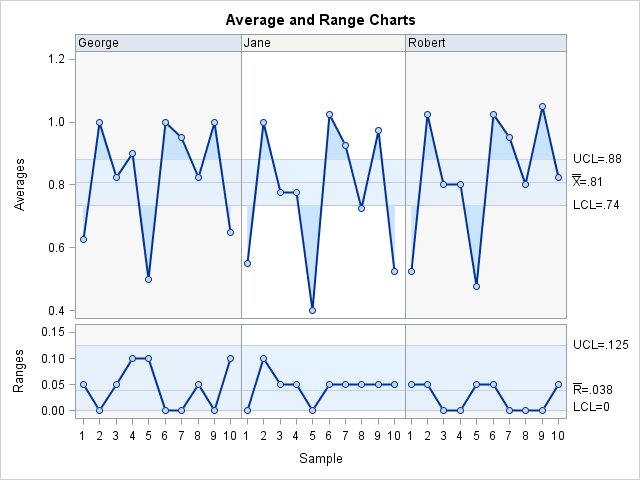
No points on the range chart are outside the limits, and the variability across operators is fairly comparable. This indicates that all operators are using the gauge in the same way. If there are any points outside the limits, they should be investigated and dealt with before you proceed.
The Gauge R&R report is shown in Output A.3.2.
Output A.3.2: Gauge R&R Results