INSET Statement: CAPABILITY Procedure
Example 5.16 Inset for Areas Under a Fitted Curve
Note: See Inset for Areas Under a Fitted Curve in the SAS/QC Sample Library.
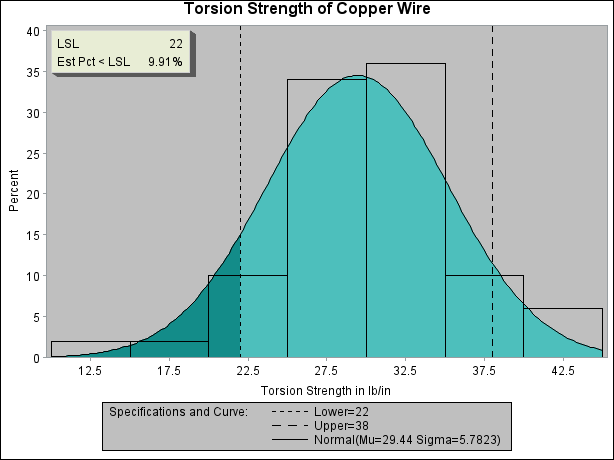
You can use the INSET keywords LSLPCT, USLPCT, and BETWEENPCT to inset legends for areas under histogram bars or fitted curves. The following statements create a histogram with an inset legend for the shaded area under the fitted normal curve to the left of the lower specification limit:
ods graphics off;
title 'Torsion Strength of Copper Wire';
legend2 FRAME CFRAME=ligr CBORDER=black POSITION=center;
proc capability data=Wire noprint;
   spec lsl=22 llsl=2  clsl=black cleft=vibg
        usl=38 lusl=20 cusl=black;
   histogram Strength /  cframe = ligr
                         cfill   = bibg
                         legend = legend2
                         normal(color=black noprint fill);
   inset  lsl='LSL' lslpct / cfill=ywh cshadow=dagr;
run;
The histogram is displayed in Output 5.16.1. The LSLPCT keyword in the INSET statement requests a legend for the area under the curve to the left of the lower specification limit. The CLEFT= option is used to fill the area under the normal curve to the left of the line, and the CFILL= color is used to fill the remaining area. If the FILL normal-option were not specified, the CLEFT= and CFILL= colors would be applied to the corresponding areas under the histogram, not the normal curve, and the inset box would reflect the area under the histogram bars.
You can use the USLPCT keyword in the INSET statement to request a legend for the area to the right of an upper specification limit, and you can use the BETWEENPCT keyword to request a legend for the area between the lower and upper limits. By default, the legend requested with each of the keywords LSLPCT, USLPCT, and BETWEENPCT displays a rectangle that matches the color of the corresponding area. You can substitute a customized label for each rectangle by specifying the keyword followed by an equal sign (=) and the label in quotes.
Output 5.16.1: Displaying Areas Under the Normal Curve

