CDFPLOT Statement: CAPABILITY Procedure

Example 5.5 Using Reference Lines with CDF Plots
Note: See CDF Plot with Superimposed Normal Curve in the SAS/QC Sample Library.
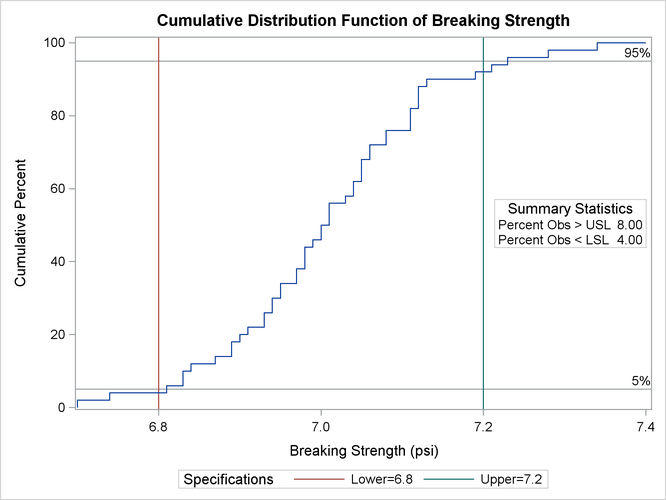
Customer requirements dictate that the breaking strengths in the previous example have upper and lower specification limits of 7.2 and 6.8 psi, respectively. Moreover, less than 5% of the cords can have breaking strengths outside the limits.
The following statements create a cdf plot with reference lines at the 5% and 95% cumulative percent levels:
proc capability data=Cord noprint;
   spec lsl=6.8 usl=7.2;
   cdf Strength / vref         = 5 95
                  vreflabels   = '5%' '95%'
                  odstitle     = title;
   inset pctgtr pctlss / format = 5.2
                         pos    = e
                         header = "Summary Statistics";
run;
The INSET statement requests an inset with the percentages of measurements above the upper limit and below the lower limit. For more information about the INSET statement, see INSET Statement: CAPABILITY Procedure.
In Output 5.5.1, the empirical cdf is below the intersection between the lower specification limit line and the 5% line, so less than 5% of the measurements are below the lower limit. The ecdf, however, is also below the intersection between the upper specification limit line and the 95% line, implying that more than 5% of the measurements are greater than the upper limit. Thus, the goal of having less than 5% of the measurements above the upper specification limit has not been met.
Output 5.5.1: Reference Lines with a Cumulative Distribution Function Plot