UCHART Statement: ANOM Procedure

Example 4.3 ANOM u Charts with Angled Axis Labels
Note: See Creating ANOM Charts with Angled Axis Labels in the SAS/QC Sample Library.
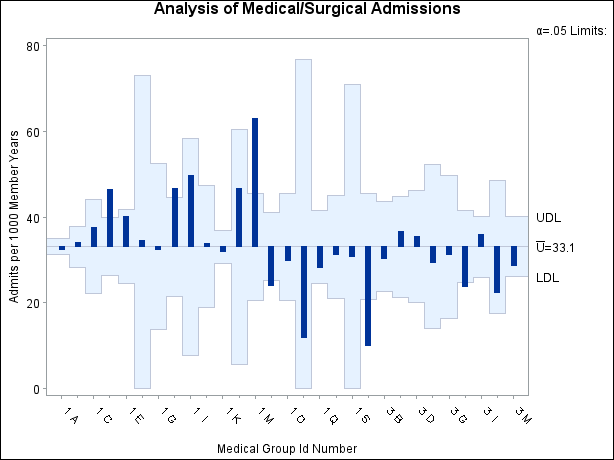
Consider the example described in Creating ANOM Charts for Rates from Group Counts. In the example, the option TURNHLABELS was used to vertically display the horizontal axis labels. You can also use an AXIS statement to create an angled display of the horizontal or vertical axes labels. The following statements create the u CHART shown in Output 4.3.1:
ods graphics off;
title 'Analysis of Medical/Surgical Admissions';
proc anom data=MSAdmits;
   uchart Count*ID / groupn   = KMemberYrs
                     nolegend
                     haxis    = axis1;
axis1 value = (a=-45 h=2.0pct);
label Count = 'Admits per 1000 Member Years';
run;
The angle is specified with the A= option in the AXIS1 statement. Valid angle values are between -90 and 90. The height of the labels is specified with the H= option in the AXIS1 statement. See Axis and Axis Label Options
in Table 4.19 for a list of UCHART statement axis options and
SAS/GRAPH: Reference for a complete description of the AXIS statement.
Output 4.3.1: ANOM u Chart for C-Sections with Angled Axis Labels