NPCHART Statement: SHEWHART Procedure

Note: See np Charts-Specifying Control Limit Info in the SAS/QC Sample Library.
This example shows how to use the DATA step to create LIMITS= data sets for use with the NPCHART statement. The variables
_VAR_ and _SUBGRP_ are required. These variables must be character variables whose lengths are no greater than 32, and their values must match
the process and subgroup-variable specified in the NPCHART statement. In addition, you must provide one of the following:
-
the variables
_LCLNP_,_NP_, and_UCLNP_ -
the variable
_P_
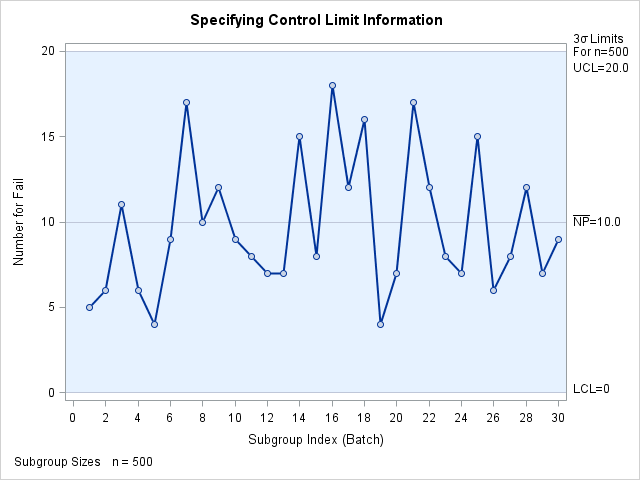
The following DATA step creates a data set named Climits1, which provides a complete set of control limits for an ![]() chart:
chart:
data Climits1;
   length _var_ _subgrp_ _type_ $8;
   _var_    = 'Fail';
   _subgrp_ = 'Batch';
   _limitn_ = 500;
   _type_   = 'STANDARD';
   _lclnp_  =  0;
   _np_     = 10;
   _uclnp_  = 20;
run;
The following statements read the control limits from the data set Climits1 and apply them to the count data in the data set Circuits, which is introduced in Creating np Charts from Count Data:
ods graphics on;
title 'Specifying Control Limit Information';
proc shewhart data=Circuits limits=Climits1;
   npchart Fail*Batch / subgroupn = 500
                        odstitle  = title
                        markers;
run;
The chart is shown in Output 17.21.1.
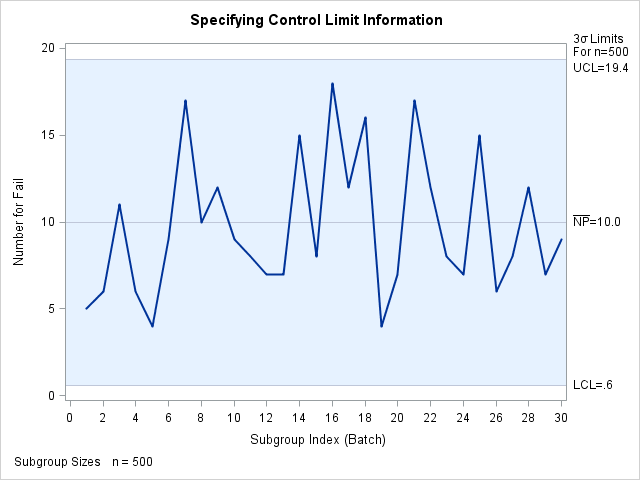
The following DATA step creates a data set named Climits2, which provides a value for the expected proportion of nonconforming items (_P_). This parameter is then used to compute
the control limits for the data in Circuits according to the equations in Control Limits.
data Climits2;
   length _var_ _subgrp_ _type_ $8;
   _var_    = 'Fail';
   _subgrp_ = 'Batch';
   _limitn_ = 500;
   _type_   = 'STANDARD';
   _p_      = .02;
run;
title 'Specifying Control Limit Information';
proc shewhart data=Circuits limits=Climits2;
   npchart Fail*Batch / subgroupn = 500
                        odstitle  = title;
run;
The chart is shown in Output 17.21.2. Note that the control limits are not the same as those shown in Output 17.21.1.