Measurement Systems Analysis

This example is taken from Wheeler (2006).
Three different operators each conducted two trails in which they measured a characteristic of six wafers. The following statements
create a SAS data set named WaferMeasurements, which contains the measurements they made:
data WaferMeasurements;
   input Operator $ Trial Sample Value;
   datalines;
A 1 1 70.52
A 1 2 74.40
A 1 3 73.54
A 1 4 75.20
A 1 5 73.99
A 1 6 71.89
A 2 1 71.03
A 2 2 76.24
A 2 3 74.68
A 2 4 74.33
A 2 5 75.39
A 2 6 74.70
B 1 1 72.08
B 1 2 77.78
B 1 3 76.93
B 1 4 78.40
B 1 5 76.04
B 1 6 75.98
B 2 1 72.89
B 2 2 78.90
B 2 3 78.93
B 2 4 76.90
B 2 5 75.01
B 2 6 72.87
C 1 1 70.56
C 1 2 76.88
C 1 3 75.34
C 1 4 75.65
C 1 5 73.91
C 1 6 73.73
C 2 1 68.61
C 2 2 78.61
C 2 3 76.35
C 2 4 75.02
C 2 5 75.46
C 2 6 71.55
;
You can use the %basicemp macro to perform the study:
%basicemp(WaferMeasurements, condition=Operator);
The average and range chart is shown is Output A.2.1.
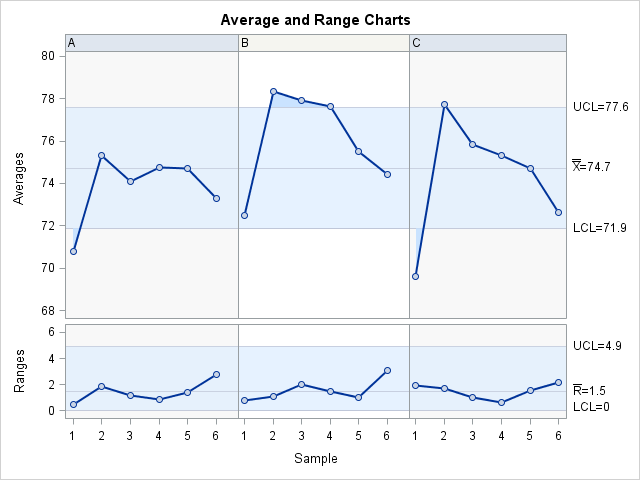
All the ranges are within the limits on the range chart, which means there is no indication of measurement inconsistency. However, the averages for the different operators do not appear to be consistent.
The main effect chart is shown in Output A.2.2.
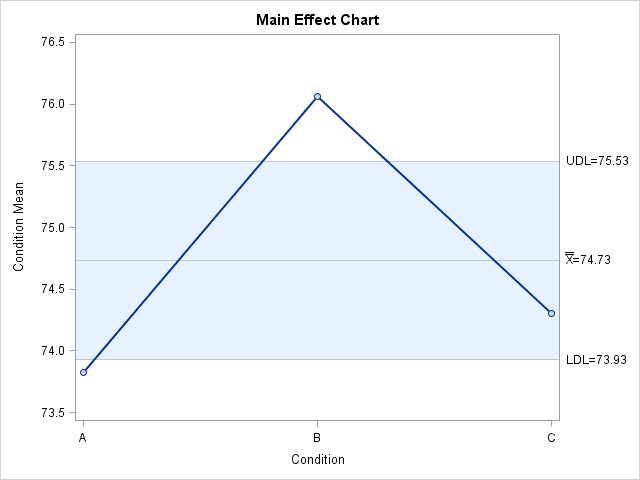
Because the means for operators A and B are both outside the limits, the mean range chart indicates operator biases in the measurements.
The mean range chart is shown in Output A.2.3.
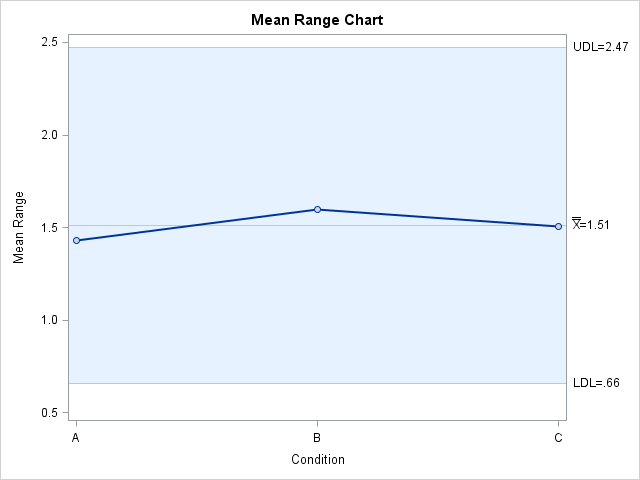
The fact that the mean range for each operator is well within the limits reinforces the conclusion that the measurement process is consistent.
The Basic EMP reports are shown in Output A.2.4.
Output A.2.4: Basic EMP Study Results
| Basic EMP Study for WaferMeasurements |
| EMP Study for One Nuisance Component | |
|---|---|
| Number of Samples | 6 |
| Number of Nuisance Component Levels | 3 |
| Number of Times Samples Measured | 2 |
| Number of Measurements Averaged in Reported Values | 1 |
| Estimated Test-Retest Error | 1.33870 |
| Probable Error | 0.90362 |
| Intraclass Correlation (Without Bias) | 0.7214 |
| System Classification | Second Class |
| Intraclass Correlation (With Bias) | 0.6054 |
Note that the values listed for the intraclass correlations with and without bias are different from those given by Wheeler. That is because the %basicemp macro estimates the product and operator variations by using standard deviations instead of ranges.