COMPHISTOGRAM Statement: CAPABILITY Procedure

Note: See Machine Study with Comparative Histogram in the SAS/QC Sample Library.
Three similar machines are used to attach a part to an assembly. One hundred assemblies are sampled from the output of each
machine, and a part position is measured in millimeters. The following statements save the measurements in a SAS data set
named Machines:
data Machines;
   input position @@;
   label position='Position in Millimeters';
   if      (_n_ <= 100) then Machine = 'Machine 1';
   else if (_n_ <= 200) then Machine = 'Machine 2';
   else                      Machine = 'Machine 3';
   datalines;
-0.17  -0.19  -0.24  -0.24  -0.12   0.07  -0.61   0.22   1.91  -0.08
-0.59   0.05  -0.38   0.82  -0.14   0.32   0.12  -0.02   0.26   0.19
-0.07   0.13  -0.49   0.07   0.65   0.94  -0.51  -0.61  -0.57  -0.51
 0.01  -0.51   0.07  -0.16  -0.32  -0.42  -0.42  -0.34  -0.34  -0.35
-0.49   0.11  -0.42   0.76   0.02  -0.59  -0.28   1.12  -0.02  -0.60
-0.64   0.13  -0.32  -0.77  -0.02  -0.07  -0.49  -0.53  -0.22   0.61
-0.23   0.02   0.53   0.23  -0.44  -0.05   0.37  -0.42   0.70  -0.35

   ... more lines ...

 0.58   0.46   0.58   0.92   0.70   0.81   0.07   0.33   0.82   0.62
 0.48   0.41   0.78   0.58   0.43   0.07   0.27   0.49   0.79   0.92
 0.79   0.66   0.22   0.71   0.53   0.57   0.90   0.48   1.17   1.03
;
Distinct specification limits for the three machines are provided in a data set named speclims.
data speclims;
   input Machine $9. _lsl_ _usl_;
   _var_ = 'position';
   datalines;
Machine 1 -0.5 0.5
Machine 2  0.0 1.0
Machine 3  0.0 1.0
;
The following statements create a comparative histogram for the measurements in Machines that displays the specification limits in speclims.
proc capability data=Machines noprint;
   spec cleft cright;
   comphist position / class      = Machine
                       nrows      = 3
                       intertile  = 1
                       midpoints  = -1.2 to 2.2 by 0.1
                       kernel(fill)
                       classspecs = speclims;
   inset mean std="Std Dev" / pos = ne format = 6.3;
run;
The display is shown in Output 5.6.1.
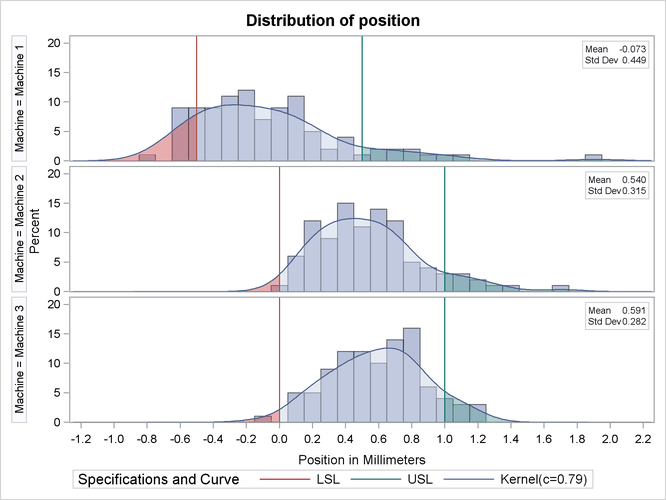
The INSET statement is used to inset the sample mean and standard deviation for each machine in the corresponding tile. The MIDPOINTS= option specifies the midpoints of the histogram bins. Kernel density estimates are displayed using the KERNEL option. The curve areas outside the specification limits are filled using the CLEFT and CRIGHT options in the SPEC statement, and the area between the limits is filled using the CFILL= option in COMPHISTOGRAM statement.