XCHART Statement: ANOM Procedure

Note: See ANOM for Cell Means in the Presence of Interaction in the SAS/QC Sample Library.
This example illustrates the use of analysis of means in an experiment with two factors where an interaction effect is present.
The following data set CleaningInteract is a modified version of the data set Cleaning, which includes an interaction effect for position and depth.
Consider the following data set CleaningInteract:
data CleaningInteract;
   do position = 1 to 5;
      do depth = 1 to 3;
         do rep = 1 to 2;
            input concentration @@;
            output;
         end;
      end;
   end;
datalines;
15 16 15 14 19  5
15 16 14 14  0  1
19 15 16 16 11  8
18 16 24 23  8 14
15 12 23 24  8 11
;
The following statements use PROC GLM to test for an interaction:
ods graphics off;
proc glm data=CleaningInteract;
   class position depth;
   model concentration = position depth position*depth;
run;
The analysis of variance results in Output 4.7.1 indicate a significant interaction between position and depth.
Since an interaction effect is present, an appropriate way to analyze the data is to create an ANOM chart for the cell means.
In order to create the chart you first need to compute the cell means and a new group variable which designates the cells. The following statements use PROC MEANS for this purpose.
proc means data=CleaningInteract n mean std;
   class position depth;
   var concentration;
   types position*depth;
   output out=cellmeans mean=concentrationX std=concentrationS;
run;
data cellmeans; set cellmeans;
   rename _FREQ_ = concentrationN;
   pos = put(position, z1.);
   dep = put(depth, z1.);
   cell  = cat('P',pos, 'D', dep);
   drop _TYPE_ pos dep;
run;
The cell means are stored in the data set cellmeans shown in Output 4.7.2:
Output 4.7.2: Data Set cellmeans
| ANOM for Effect of Position |
| Analysis Variable : concentration | |||||
|---|---|---|---|---|---|
| position | depth | N Obs | N | Mean | Std Dev |
| 1 | 1 | 2 | 2 | 15.5000000 | 0.7071068 |
| 2 | 2 | 2 | 14.5000000 | 0.7071068 | |
| 3 | 2 | 2 | 12.0000000 | 9.8994949 | |
| 2 | 1 | 2 | 2 | 15.5000000 | 0.7071068 |
| 2 | 2 | 2 | 14.0000000 | 0 | |
| 3 | 2 | 2 | 0.5000000 | 0.7071068 | |
| 3 | 1 | 2 | 2 | 17.0000000 | 2.8284271 |
| 2 | 2 | 2 | 16.0000000 | 0 | |
| 3 | 2 | 2 | 9.5000000 | 2.1213203 | |
| 4 | 1 | 2 | 2 | 17.0000000 | 1.4142136 |
| 2 | 2 | 2 | 23.5000000 | 0.7071068 | |
| 3 | 2 | 2 | 11.0000000 | 4.2426407 | |
| 5 | 1 | 2 | 2 | 13.5000000 | 2.1213203 |
| 2 | 2 | 2 | 23.5000000 | 0.7071068 | |
| 3 | 2 | 2 | 9.5000000 | 2.1213203 | |
| ANOM for Effect of Position |
| position | depth | concentrationN | concentrationX | concentrationS | cell |
|---|---|---|---|---|---|
| 1 | 1 | 2 | 15.5 | 0.70711 | P1D1 |
| 1 | 2 | 2 | 14.5 | 0.70711 | P1D2 |
| 1 | 3 | 2 | 12.0 | 9.89949 | P1D3 |
| 2 | 1 | 2 | 15.5 | 0.70711 | P2D1 |
| 2 | 2 | 2 | 14.0 | 0.00000 | P2D2 |
| 2 | 3 | 2 | 0.5 | 0.70711 | P2D3 |
| 3 | 1 | 2 | 17.0 | 2.82843 | P3D1 |
| 3 | 2 | 2 | 16.0 | 0.00000 | P3D2 |
| 3 | 3 | 2 | 9.5 | 2.12132 | P3D3 |
| 4 | 1 | 2 | 17.0 | 1.41421 | P4D1 |
| 4 | 2 | 2 | 23.5 | 0.70711 | P4D2 |
| 4 | 3 | 2 | 11.0 | 4.24264 | P4D3 |
| 5 | 1 | 2 | 13.5 | 2.12132 | P5D1 |
| 5 | 2 | 2 | 23.5 | 0.70711 | P5D2 |
| 5 | 3 | 2 | 9.5 | 2.12132 | P5D3 |
The data set cellmeans has the structure of a SUMMARY= input data set for the ANOM procedure. For details concerning a SUMMARY= data set, see the
section Creating ANOM Charts for Means from Group Summary Data.
The following statements use cellmeans to create the ANOM chart for the cell means using SUMMARY= option:
ods graphics off;
title "ANOM for Cell Means of Position and Depth";
proc ANOM summary = cellmeans;
   xchart concentration * cell / turnhlabels;
   label concentrationX = 'Mean of Concentration';
   label cell           = 'Cell';
run;
The chart is shown in Output 4.7.3:
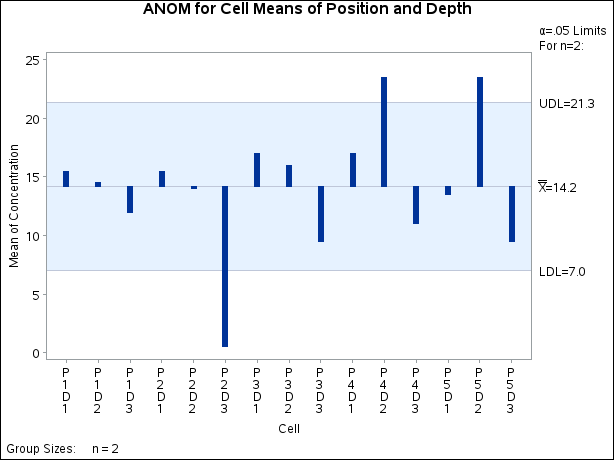
The chart shows that the cell means for P2D3, P4D2, and P5D2 are significantly different from the average concentration level.