PCHART Statement: ANOM Procedure

Note: See Creating ANOM p Charts from Group Summary Data in the SAS/QC Sample Library.
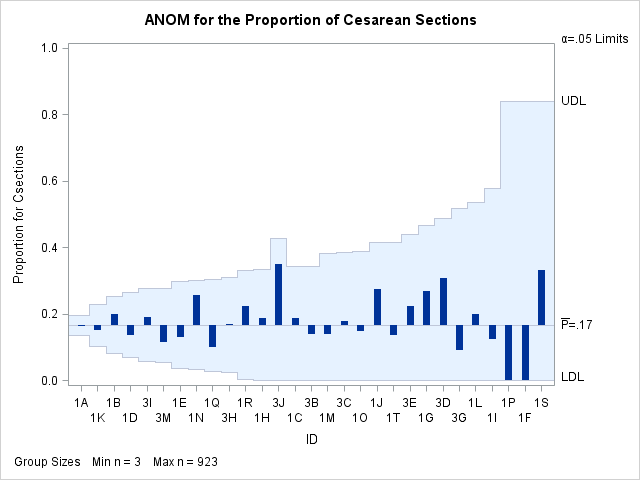
The previous example illustrates how you can create ANOM charts for proportions using count data. However, in many applications, the group data are provided in summarized form as proportions or percentages. This example illustrates how you can use the PCHART statement with data of this type.
The following data set provides the data from the preceding example in summarized form:
data CsectProp;
   length ID $ 2;
   input ID CsectionsP CsectionsN @@;
   datalines;
1A  0.163  923   1K  0.151  298   1B  0.200  170   1D  0.136  132
3I  0.189  106   3M  0.114  105   1E  0.130   77   1N  0.257   74
1Q  0.101   69   3H  0.169   65   1R  0.224   49   1H  0.188   48
3J  0.350   20   1C  0.186   43   3B  0.140   43   1M  0.138   29
3C  0.179   28   1O  0.148   27   1J  0.273   22   1T  0.136   22
3E  0.222   18   1G  0.267   15   3D  0.308   13   3G  0.091   11
1L  0.200   10   1I  0.125    8   1P  0.000    3   1F  0.000    3
1S  0.333    3
;
A partial listing of CsectProp is shown in Figure 4.12. The groups are still indexed by ID. The variable CsectionsP contains the proportions of c-sections, and the variable CsectionsN contains the group sample sizes.
You can analyze this data set by specifying it as a SUMMARY= data set in the PROC ANOM statement.
Note that Csections is not the name of a SAS variable in the data set but is, instead, the common prefix for the names of the two SAS variables CsectionsP and CsectionsN. The suffix characters P and N indicate proportion and sample size, respectively. Thus, you can specify two group variables in a SUMMARY= data set with a single name Csections, which is referred to as the response. The name ID specified after the asterisk is the name of the group-variable.
A SUMMARY= data set used with the PCHART statement must contain the following variables:
-
group variable
-
group proportion variable
-
group sample size variable
Furthermore, the names of the group proportion and sample size variables must begin with the response name specified in the PCHART statement and end with the special suffix characters P and N, respectively.
For more information, see SUMMARY= Data Set.
The following statements create a p Chart for C-Sections using the SUMMARY= data set CsectProp:
ods graphics on;
title 'ANOM for the Proportion of Cesarean Sections';
proc anom summary=CsectProp;
   pchart Csections*ID / odstitle = title1;
run;
The ODS GRAPHICS ON statement specified before the PROC ANOM statement enables ODS Graphics, so the p chart is created using ODS Graphics instead of traditional graphics. The resulting ANOM p chart is shown in Figure 4.13.