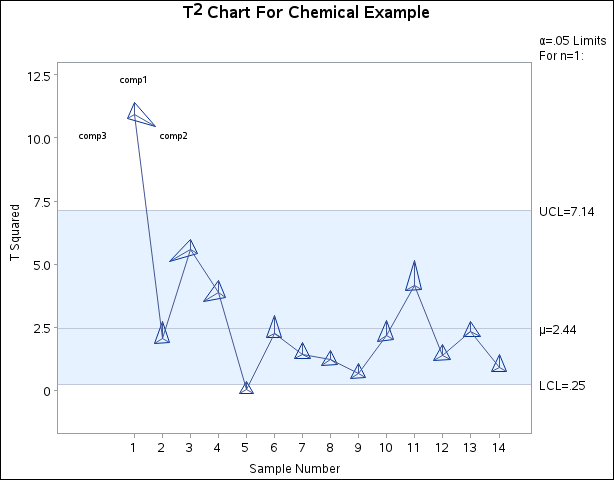
You can use the star options in the SHEWHART procedure to superimpose points on the chart with stars whose vertices represent standardized values of the
squares of the three principal components used to determine ![]() .
.
title 'T' m=(+0,+0.5) '2'
          m=(+0,-0.5) ' Chart For Chemical Example';
symbol value=none;
proc shewhart table=Prin;
   xchart tsquare*Sample /
      starvertices  = (comp1 comp2 comp3)
      startype      = wedge
      starlegend    = none
      starlabel     = first
      staroutradius = 4
      npanelpos     = 14
      xsymbol       = mu
      nolegend ;
run;
The chart is displayed in Figure 17.222. In situations where the principal components have a physical interpretation, the star chart can be a helpful diagnostic for determining the relative contributions of the different components.
For more information about star charts, see the section Displaying Auxiliary Data with Stars, or consult the entries for the STARVERTICES= and related options in Dictionary of Options: SHEWHART Procedure.
Principal components are not the only approach that can be used to interpret multivariate control charts. This problem has recently been studied by a number of authors, including Doganaksoy, Faltin, and Tucker (1991), Hawkins (1991, 1993), and Mason, Tracy, and Young (1993).