XSCHART Statement: SHEWHART Procedure

Note: See Mean and Standard Deviation Charts Examples in the SAS/QC Sample Library.
The previous example illustrates how you can create ![]() and s charts using raw data (process measurements). However, in many applications the data are provided as subgroup summary statistics.
This example illustrates how you can use the XSCHART statement with data of this type.
and s charts using raw data (process measurements). However, in many applications the data are provided as subgroup summary statistics.
This example illustrates how you can use the XSCHART statement with data of this type.
The following data set (Oilsum) provides the data from the preceding example in summarized form:
data Oilsum;
   input Day KWattsX KWattsS KWattsN;
   informat Day date7. ;
   format Day date5. ;
   label Day='Date of Measurement';
   datalines;
04JUL94 3487.40 220.260 20
05JUL94 3471.65 210.427 20
06JUL94 3488.30 147.025 20
07JUL94 3434.20 157.637 20
08JUL94 3475.80 258.949 20
09JUL94 3518.10 211.566 20
10JUL94 3492.65 193.779 20
11JUL94 3496.40 212.024 20
12JUL94 3398.50 199.201 20
13JUL94 3456.05 173.455 20
14JUL94 3493.60 187.465 20
15JUL94 3563.30 205.472 20
16JUL94 3519.05 173.676 20
17JUL94 3474.20 200.576 20
18JUL94 3443.60 222.084 20
19JUL94 3586.35 185.724 20
20JUL94 3486.45 223.474 20
21JUL94 3492.90 145.267 20
22JUL94 3432.80 190.994 20
23JUL94 3496.90 208.858 20
;
A partial listing of Oilsum is shown in Figure 17.115.
Figure 17.115: The Summary Data Set Oilsum
| Summary Data Set for Power Output |
| Day | KWattsX | KWattsS | KWattsN |
|---|---|---|---|
| 04JUL | 3487.40 | 220.260 | 20 |
| 05JUL | 3471.65 | 210.427 | 20 |
| 06JUL | 3488.30 | 147.025 | 20 |
| 07JUL | 3434.20 | 157.637 | 20 |
| 08JUL | 3475.80 | 258.949 | 20 |
There is exactly one observation for each subgroup (note that the subgroups are still indexed by Day). The variable KWattsX contains the subgroup means, the variable KWattsS contains the subgroup standard deviations, and the variable KWattsN contains the subgroup sample sizes (which are all 20). You can read this data set by specifying it as a HISTORY= data set
in the PROC SHEWHART statement, as follows:
options nogstyle;
goptions ftext=swiss;
symbol color = salmon h = .8;
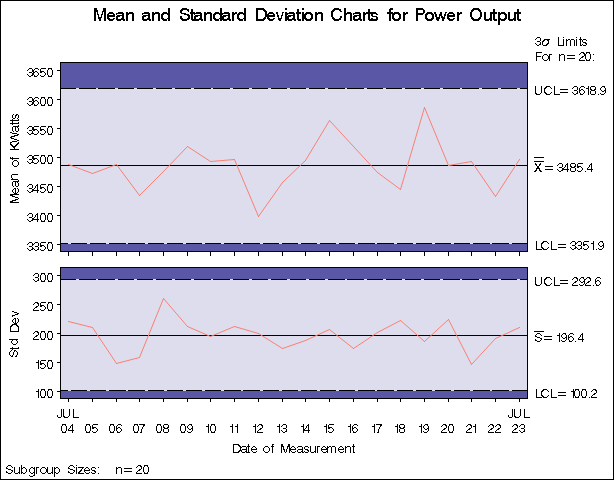
title 'Mean and Standard Deviation Charts for Power Output';
proc shewhart history=Oilsum;
xschart KWatts*Day / cframe = lib
cinfill = bwh
cconnect = salmon;
run;
options gstyle;
The NOGSTYLE system option causes ODS styles not to affect traditional graphics. Instead, the SYMBOL statement and XSCHART
statement options control the appearance of the graph. The GSTYLE system option restores the use of ODS styles for traditional
graphics produced subsequently. The resulting ![]() and s charts are shown in Figure 17.116.
and s charts are shown in Figure 17.116.
Note that KWatts is not the name of a SAS variable in the data set Oilsum but is, instead, the common prefix for the names of the three SAS variables KWattsX, KWattsS, and KWattsN. The suffix characters X, S, and N indicate mean, standard deviation, and sample size, respectively. Thus, you can specify three subgroup summary variables in the HISTORY= data set with a single name (KWatts), which is referred to as the process. The name Day specified after the asterisk is the name of the subgroup-variable.
In general, a HISTORY= input data set used with the XSCHART statement must contain the following variables:
-
subgroup variable
-
subgroup mean variable
-
subgroup standard deviation variable
-
subgroup sample size variable
Furthermore, the names of the subgroup mean, standard deviation, and sample size variables must begin with the process name specified in the XSCHART statement and end with the special suffix characters X, S, and N, respectively. If the names do not follow this convention, you can use the RENAME option to rename the variables for the duration of the SHEWHART procedure step. For an illustration, see Example 17.42.
In summary, the interpretation of process depends on the input data set:
-
If raw data are read using the DATA= option (as in the previous example), process is the name of the SAS variable containing the process measurements.
-
If summary data are read using the HISTORY= option (as in this example), process is the common prefix for the names of the variables containing the summary statistics.
For more information, see HISTORY= Data Set.