RCHART Statement: SHEWHART Procedure

Note: See Range Chart (R Chart) Examples in the SAS/QC Sample Library.
In the previous example, the OUTLIMITS= data set Disklim saved control limits computed from the measurements in Disks. This example shows how these limits can be applied to new data provided in the following data set:
data Disks2;
   input Lot @;
   do i=1 to 6;
      input Time @;
      output;
   end;
   drop i;
   datalines;
26 7.93 7.97 7.89 7.81 7.88 7.92
27 7.86 7.91 7.87 7.89 7.83 7.87
28 7.93 7.95 7.90 7.89 7.88 7.90
29 7.97 8.00 7.86 7.89 7.84 7.78
30 7.91 7.93 7.98 7.93 7.83 7.88
31 7.85 7.94 7.88 7.98 7.96 7.84
32 7.86 8.01 7.88 7.95 7.90 7.89
33 7.87 7.93 7.96 7.89 7.81 8.00
34 7.87 7.97 7.95 7.89 7.92 7.84
35 7.92 7.97 7.90 7.88 7.89 7.86
36 7.96 7.90 7.90 7.84 7.90 8.00
37 7.92 7.90 7.98 7.92 7.94 7.94
38 7.88 7.99 8.02 7.98 7.88 7.92
39 7.89 7.91 7.92 7.90 7.94 7.94
40 7.84 7.88 7.91 7.98 7.87 7.93
41 7.91 7.87 7.96 7.91 7.89 7.92
42 7.96 7.93 7.86 7.93 7.86 7.94
43 7.84 7.82 7.87 7.91 7.91 8.01
44 7.93 7.91 7.92 7.88 7.91 7.86
45 7.95 7.92 7.93 7.90 7.86 8.00
;
The following statements create an R chart using the control limits in Disklim:
ods graphics on;
title 'Range Chart for Disk Drive Test Times';
proc shewhart data=Disks2 limits=Disklim;
   rchart Time*Lot / odstitle=title;
run;
The ODS GRAPHICS ON statement specified before the PROC SHEWHART statement enables ODS Graphics, so the R chart is created using ODS Graphics instead of traditional graphics. The chart is shown in Figure 17.76.
The LIMITS= option in the PROC SHEWHART statement specifies the data set containing the control limits. By default, this information is read from the first observation in the LIMITS= data set for which
-
the value of
_VAR_matches the process nameTime -
the value of
_SUBGRP_matches the subgroup-variable nameLot
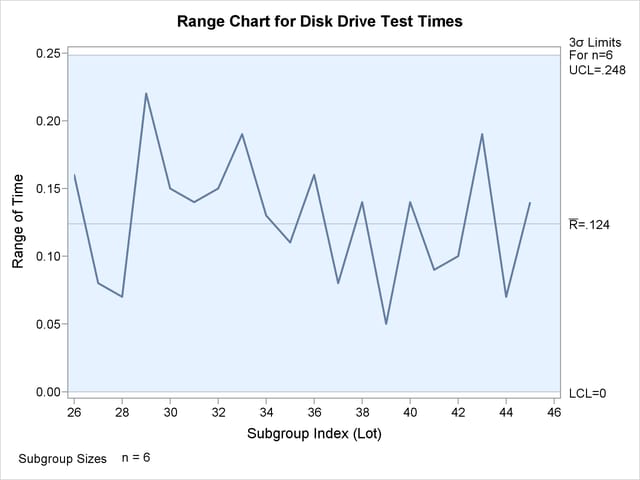
All the ranges lie within the control limits, indicating that the variability in disk drive performance is still in statistical control.
In this example, the LIMITS= data set was created in a previous run of the SHEWHART procedure. You can also create a LIMITS= data set with the DATA step. See Example 17.28 and LIMITS= Data Set for details concerning the variables that you must provide.