NPCHART Statement: SHEWHART Procedure

Note: See np Charts with Unequal Subgroup Sample Sizes in the SAS/QC Sample Library.
The following statements create a SAS data set named Battery, which contains the number of alkaline batteries per lot failing an acceptance test. The number of batteries tested in each
lot varies but is approximately 150.
data Battery;
   length Lot $3;
   input Lot nFailed Sampsize @@;
   label nFailed ='Number Failed'
         Lot     = 'Lot Number'
         Sampsize='Number Sampled';
   datalines;
AE3  6  151     AE4  5  142     AE9  6  145
BR3  9  149     BR7  3  150     BR8  0  156
BR9  4  150     DB1  9  158     DB2  4  152
DB3  0  162     DB5  9  140     DB6  7  161
DS4  6  154     DS6  1  144     DS8  5  154
JG1  3  151     MC3  8  148     MC4  2  143
MK6  4  150     MM1  4  147     MM2  0  150
RT5  2  154     RT9  8  149     SP1  3  160
SP3  9  153
;
The variable nFailed contains the number of battery failures, the variable Lot contains the lot number, and the variable Sampsize contains the lot sample size. The following statements request an ![]() chart for this data:
chart for this data:
title 'Number of Battery Failures';
proc shewhart data=Battery;
   npchart nFailed*Lot / subgroupn = Sampsize
                         outlimits = Batlim
                         odstitle  = title;
   label nFailed='Number Failed';
run;
The chart is shown in Output 17.20.1, and the OUTLIMITS= data set Batlim is listed in Output 17.20.2.
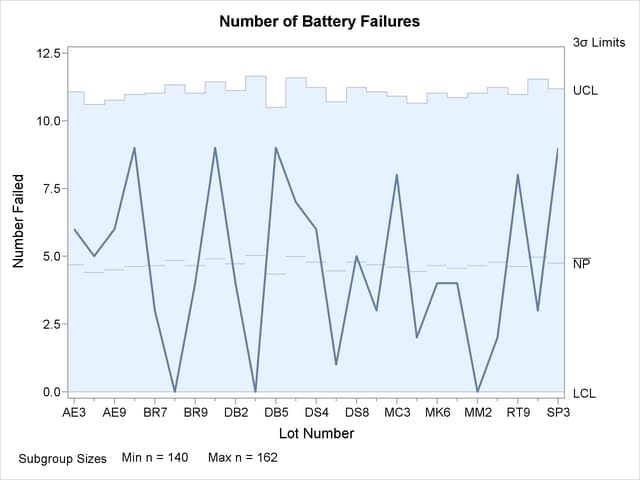
Note that the upper control limit and central line on the ![]() chart vary with the subgroup sample size. The lower control limit is truncated at zero. The sample size legend indicates
the minimum and maximum subgroup sample sizes.
chart vary with the subgroup sample size. The lower control limit is truncated at zero. The sample size legend indicates
the minimum and maximum subgroup sample sizes.
Output 17.20.2: The Control Limits Data Set Batlim
| Control Limits for Battery Failures |
| _VAR_ | _SUBGRP_ | _TYPE_ | _LIMITN_ | _ALPHA_ | _SIGMAS_ | _P_ | _LCLNP_ | _NP_ | _UCLNP_ |
|---|---|---|---|---|---|---|---|---|---|
| nFailed | Lot | ESTIMATE | V | V | 3 | 0.031010 | V | V | V |
The variables in Batlim whose values vary with subgroup sample size are assigned the special missing value V.
The SHEWHART procedure provides various options for working with unequal subgroup sample sizes. For example, you can use the LIMITN= option to specify a fixed (nominal) sample size for computing the control limits, as illustrated by the following statements:
ods graphics off;
title 'Number of Battery Failures';
proc shewhart data=Battery;
   npchart nFailed*Lot / subgroupn = Sampsize
                         limitn    = 150
                         alln;
   label nFailed='Number Failed';
run;
The ALLN option specifies that all points (regardless of subgroup sample size) are to be displayed. By default, only points for subgroups whose sample size matches the LIMITN= value are displayed. The chart is shown in Output 17.20.3.
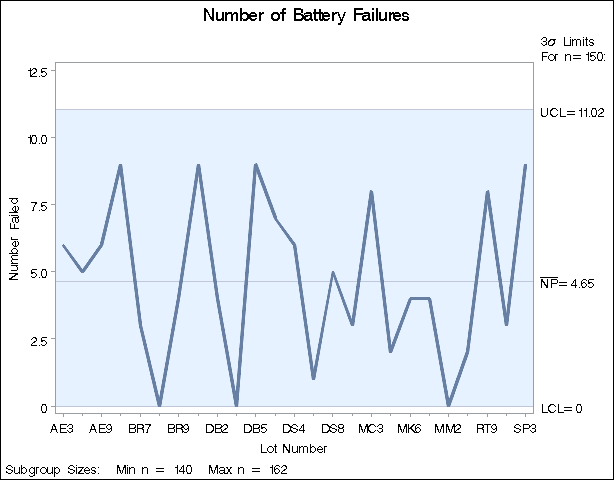
All the points are inside the control limits, indicating that the process is in statistical control. Since there is relatively little variation in the sample sizes, the control limits in Output 17.20.3 provide a close approximation to the exact control limits in Output 17.20.1, and the same conclusions can be drawn from both charts. In general, you should be careful when interpreting charts that use a nominal sample size to compute control limits, since these limits are only approximate when the sample sizes vary.