CCHART Statement: SHEWHART Procedure

Note: See c Chart Examples in the SAS/QC Sample Library.
A c chart is used to monitor the number of paint defects on new trucks. Twenty trucks of the same model are inspected, and the
number of paint defects per truck is recorded. The following statements create a SAS data set named Trucks, which contains the defect counts:
data Trucks;
   input TruckID $ Defects @@;
   label TruckID='Truck Identification Number'
         Defects='Number of Paint Defects';
   datalines;
C1   5   C2   4   C3   4   C4   8   C5  7
C6  12   C7   3   C8  11   E4   8   E9  4
E7   9   E6  13   A3   5   A4   4   A7  9
Q1  15   Q2   8   Q3   9   Q9  10   Q4  8
;
A partial listing of Trucks is shown in Figure 17.15.
Figure 17.15: The Data Set Trucks
| Paint Defects on New Trucks |
| TruckID | Defects |
|---|---|
| C1 | 5 |
| C2 | 4 |
| C3 | 4 |
| C4 | 8 |
| C5 | 7 |
There is a single observation per truck. The variable TruckID identifies the subgroup sample and is referred to as the subgroup-variable. The variable Defects contains the number of nonconformities in each subgroup sample and is referred to as the process variable (or process for short).
The following statements create the c chart shown in Figure 17.16:
ods graphics off;
title 'c Chart for Paint Defects on New Trucks';
proc shewhart data=Trucks;
   cchart Defects*TruckID;
run;
This example illustrates the basic form of the CCHART statement. After the keyword CCHART, you specify the process to analyze (in this case, Defects) followed by an asterisk and the subgroup-variable (TruckID).
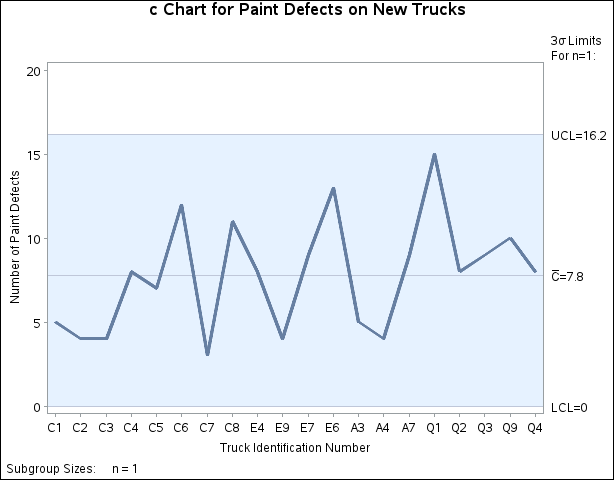
Each point on the c chart represents the number of nonconformities for a particular subgroup. For instance, the value plotted for the first subgroup
is 5 (since there are five paint defects on the first truck). By default, the control limits shown are 3![]() limits estimated from the data; the formulas are given in Control Limits. Since none of the points exceed the
limits estimated from the data; the formulas are given in Control Limits. Since none of the points exceed the ![]() limits, the c chart indicates that the painting process is in statistical control.
limits, the c chart indicates that the painting process is in statistical control.
See Constructing Charts for Numbers of Nonconformities (c Charts) for details concerning c charts. For more details on reading raw data, see DATA= Data Set.