SCHART Statement: SHEWHART Procedure

See SHWSEX1 in the SAS/QC Sample LibraryIn some applications, a standard value ![]() may be available for the process standard deviation
may be available for the process standard deviation ![]() . This example shows how you can specify
. This example shows how you can specify ![]() to compute the control limits.
to compute the control limits.
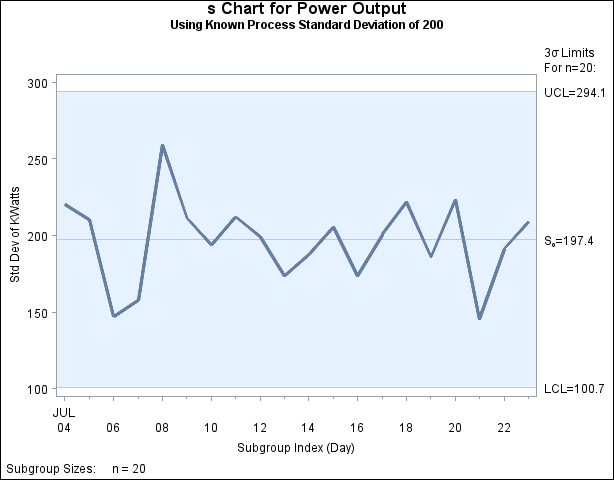
Suppose that the amount of power needed to heat water in the heating process described in Creating Standard Deviation Charts from Raw Data has a known standard deviation of 200. The following statements specify this known value and create an s chart, shown in Output 17.29.1, for the power output measurements in the data set Turbine:
ods graphics off;
title 's Chart for Power Output';
title2 'Using Known Process Standard Deviation of 200';
proc shewhart data=Turbine;
   schart KWatts*Day / sigma0  = 200
                       ssymbol = s0;
run;
The SIGMA0= option specifies ![]() , and the SSYMBOL= option specifies a label for the central line indicating that the central line is computed from
, and the SSYMBOL= option specifies a label for the central line indicating that the central line is computed from ![]() . Since all the points lie within the limits, you can conclude that the variability of the process is stable.
. Since all the points lie within the limits, you can conclude that the variability of the process is stable.
You can also specify ![]() as the value of the variable
as the value of the variable _STDDEV_ in a LIMITS= data set, as illustrated by the following statements:[79]
data Plimits;
   length _var_ _subgrp_ _type_ $8;
   _var_    = 'KWatts';
   _subgrp_ = 'Day';
   _type_   = 'STDSIGMA';
   _limitn_ = 20;
   _stddev_ = 200;
run;

title 'Chart Using Known Process Standard Deviation';
proc shewhart data=Turbine limits=Plimits;
   schart KWatts*Day / ssymbol=s0;
run;
The resulting s chart (not shown here) is identical to the one shown in Output 17.29.1. For more information, see LIMITS= Data Set.