NPCHART Statement: SHEWHART Procedure
See SHWNP5 in the SAS/QC Sample LibraryThis example shows how to use the DATA step to create LIMITS= data sets for use with the NPCHART statement. The variables
_VAR_ and _SUBGRP_ are required. These variables must be character variables whose lengths are no greater than 32, and their values must match
the process and subgroup-variable specified in the NPCHART statement. In addition, you must provide one of the following:
-
the variables
_LCLNP_,_NP_, and_UCLNP_ -
the variable
_P_
The following DATA step creates a data set named Climits1, which provides a complete set of control limits for an ![]() chart:
chart:
data Climits1;
   length _var_ _subgrp_ _type_ $8;
   _var_    = 'Fail';
   _subgrp_ = 'Batch';
   _limitn_ = 500;
   _type_   = 'STANDARD';
   _lclnp_  =  0;
   _np_     = 10;
   _uclnp_  = 20;
run;
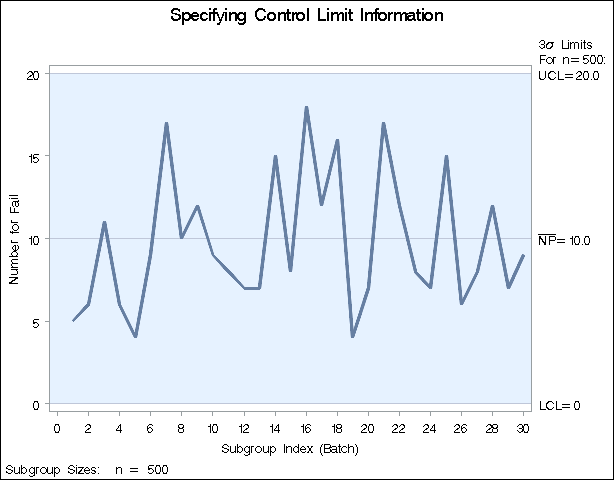
The following statements read the control limits[66] from the data set Climits1 and apply them to the count data in the data set Circuits, which is introduced in Creating np Charts from Count Data:
ods graphics off;
title 'Specifying Control Limit Information';
proc shewhart data=Circuits limits=Climits1;
   npchart Fail*Batch / subgroupn = 500;
run;
The chart is shown in Output 17.21.1.
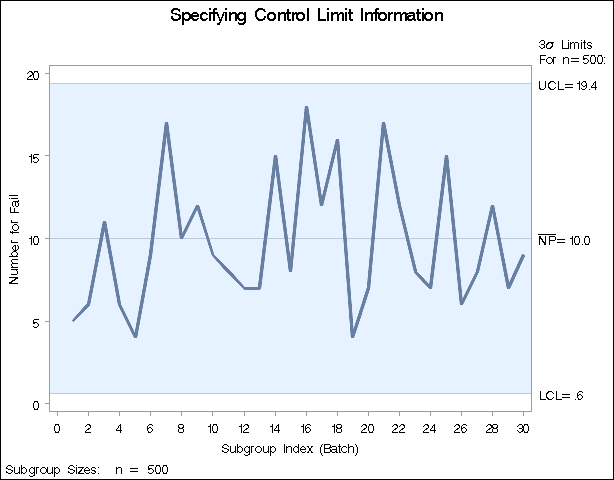
The following DATA step creates a data set named Climits2, which provides a value for the expected proportion of nonconforming items (_P_). This parameter is then used to compute
the control limits for the data in Circuits according to the equations in Control Limits.
data Climits2;
   length _var_ _subgrp_ _type_ $8;
   _var_    = 'Fail';
   _subgrp_ = 'Batch';
   _limitn_ = 500;
   _type_   = 'STANDARD';
   _p_      = .02;
run;
title 'Specifying Control Limit Information';
proc shewhart data=Circuits limits=Climits2;
   npchart Fail*Batch / subgroupn = 500;
run;
The chart is shown in Output 17.21.2. Note that the control limits are not the same as those shown in Output 17.21.1.


