CCHART Statement: SHEWHART Procedure

See SHWCEX1 in the SAS/QC Sample LibraryThis example illustrates how you can apply tests for special causes to make c charts more sensitive to special causes of variation. Twenty trucks of the same model are inspected, and the number of paint
defects per truck is recorded. The following statements create a SAS data set named Trucks3:
data Trucks3;
   input TruckID $ Defects @@;
   label TruckID='Truck Identification Number'
         Defects='Number of Paint Defects';
   datalines;
B1  12    B2  4    B3  4    B4   3
B5   4    D1  2    D2  3    D3   3
D4   2    D9  4    M2  9    M6  13
L3   5    L4  4    L7  6    Z1  15
Z2   8    Z3  9    Z7  6    Z9   8
;
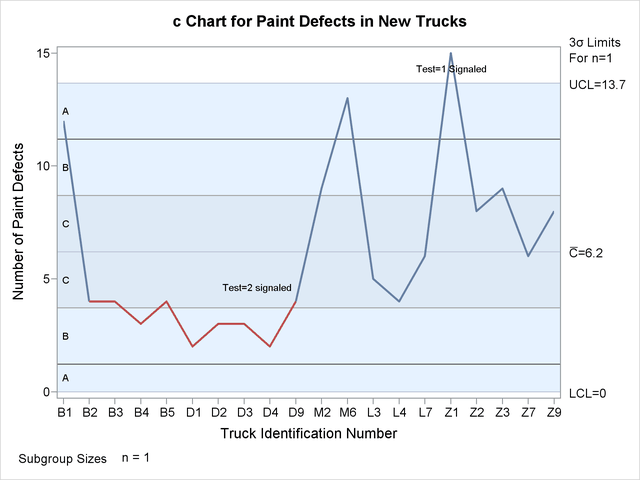
The following statements create a c chart and tabulate the information on the chart. The chart and table are shown in Output 17.8.1 and Output 17.8.2.
ods graphics on;
title1 'c Chart for Paint Defects in New Trucks';
title2 'Tests=1 to 4';
proc shewhart data=Trucks3;
   cchart Defects*TruckID / tests      = 1 to 4
                            testlabel1 = 'Test=1 Signaled'
                            testlabel2 = 'Test=2 signaled'
                            odstitle   = title
                            zonelabels
                            tabletests
                            tablelegend;
run;
The TESTS= option requests Tests 1, 2, 3, and 4, which are described in Tests for Special Causes: SHEWHART Procedure. Only Tests 1, 2, 3, and 4 are recommended for c charts. The TESTLABEL1= and TESTLABEL2= options specify the labels for points where Tests 1 and 2 are positive. The TESTFONT= option specifies the font for the labels indicating points at which the tests are positive.
Output 17.8.2: Tabular Form of c Chart
| c Chart for Paint Defects in New Trucks |
| Tests=1 to 4 |
| c Chart Summary for Defects | |||||
|---|---|---|---|---|---|
| TruckID | Subgroup Sample Size |
3 Sigma Limits with n=1 for Count |
Special Tests Signaled |
||
| Lower Limit |
Subgroup Count |
Upper Limit |
|||
| B1 | 1.00000 | 0 | 12.000000 | 13.669940 | |
| B2 | 1.00000 | 0 | 4.000000 | 13.669940 | |
| B3 | 1.00000 | 0 | 4.000000 | 13.669940 | |
| B4 | 1.00000 | 0 | 3.000000 | 13.669940 | |
| B5 | 1.00000 | 0 | 4.000000 | 13.669940 | |
| D1 | 1.00000 | 0 | 2.000000 | 13.669940 | |
| D2 | 1.00000 | 0 | 3.000000 | 13.669940 | |
| D3 | 1.00000 | 0 | 3.000000 | 13.669940 | |
| D4 | 1.00000 | 0 | 2.000000 | 13.669940 | |
| D9 | 1.00000 | 0 | 4.000000 | 13.669940 | 2 |
| M2 | 1.00000 | 0 | 9.000000 | 13.669940 | |
| M6 | 1.00000 | 0 | 13.000000 | 13.669940 | |
| L3 | 1.00000 | 0 | 5.000000 | 13.669940 | |
| L4 | 1.00000 | 0 | 4.000000 | 13.669940 | |
| L7 | 1.00000 | 0 | 6.000000 | 13.669940 | |
| Z1 | 1.00000 | 0 | 15.000000 | 13.669940 | 1 |
| Z2 | 1.00000 | 0 | 8.000000 | 13.669940 | |
| Z3 | 1.00000 | 0 | 9.000000 | 13.669940 | |
| Z7 | 1.00000 | 0 | 6.000000 | 13.669940 | |
| Z9 | 1.00000 | 0 | 8.000000 | 13.669940 | |
| Test Descriptions | |
|---|---|
| Test 1 | One point beyond Zone A (outside control limits) |
| Test 2 | Nine points in a row on one side of center line |
The ZONELABELS option requests zone lines and displays zone labels on the chart. The zones are used to define the tests. The TABLETESTS option requests a table of counts of nonconformities, subgroup sample sizes, and control limits, together with a column indicating the subgroups at which the tests are positive. The TABLELEGEND option adds a legend describing the tests that are positive.
Output 17.8.1 and Output 17.8.2 indicate that Test 1 is positive at Truck Z1 and Test 2 is positive at Truck D9.