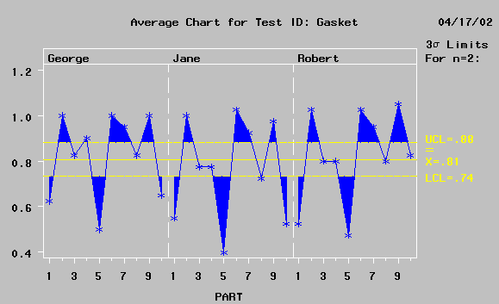
The average control chart shows both the consistency of operator variability (reproducibility) and part-to-part variation. The averages of the measurements for each part and each operator are displayed, as shown in Figure A.22.
For example, in Table A.1 the average for operator Jane, part 4 is calculated as ![]() . Similarly computed averages are displayed for each operator and each part.
. Similarly computed averages are displayed for each operator and each part.
Operator variability can be seen by comparing the operator averages for each part. These averages will differ when there is variation.
The average chart also shows part-to-part differences. The averages should fall outside the control limits since the control limits are based on gage error (repeatability). If the averages do not fall outside the control limits, the part-to-part variation is hidden in the gage variation. The average chart shows the ability of the measurement system to measure parts. The measurement system is generally considered adequate if most of the averages fall outside the limits and if the out-of-control averages tend to be the same for each operator.
Note that this is not a standard use of the Shewhart chart. Ordinarily the fact that the points fall outside the control limits would raise concerns that the process is out of control, but here the opposite conclusion is drawn.
The average chart is created with the XCHART statement of the SHEWHART procedure. For further information, see XCHART Statement: SHEWHART Procedure.