The range chart is a graphical method for assessing repeatability. It indicates whether the gage variability is consistent. The ranges for each part and each operator are displayed, as shown in Figure A.21.
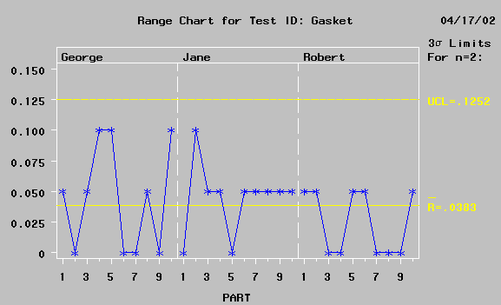
For example, in Table A.1 the range for operator George, part 1 is calculated as ![]() . Similarly computed ranges are displayed for each operator and each part.
. Similarly computed ranges are displayed for each operator and each part.
You should investigate out-of-control points and deal with them before proceeding. If you notice that one operator’s ranges are out of control, it implies that his technique differs from the others. If all operators have some out-of-control ranges, you might conclude that operator technique is affecting the measurement system and investigate the need for training.
The range chart is created with the RCHART statement of the SHEWHART procedure. For further information, see RCHART Statement: SHEWHART Procedure.