COMPHISTOGRAM Statement: CAPABILITY Procedure
See CAPCMH3 in the SAS/QC Sample LibraryTwo suppliers (A and B) provide disk drives for a computer manufacturer. The manufacturer measures the disk drive opening width to compare the process capabilities of the suppliers and determine whether there has been an improvement from 1992 to 1993.
The following statements save the measurements in a data set named Disk. There are two classification variables, Supplier and Year, and a format is associated with Year.
proc format ;
   value mytime  1 = '1992'
                 2 = '1993' ;

data disk;
   input @1 supplier $10. year width;
   label width = 'Opening Width (inches)';
   format year mytime.;
   datalines;
Supplier A   1   1.8932
Supplier A   1   1.8952
    .        .    .
    .        .    .
Supplier B   1   1.8980
Supplier B   1   1.8986
Supplier A   2   1.8978
Supplier A   2   1.8966
    .        .    .
    .        .    .
Supplier B   2   1.8967
Supplier B   2   1.8997
;
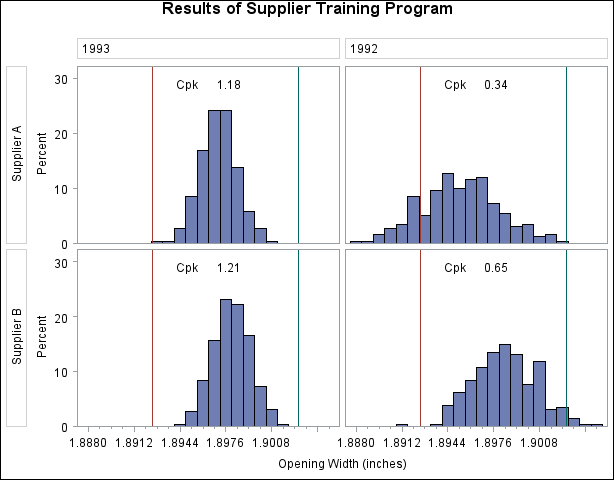
The following statements create the comparative histogram in Output 5.7.1:
* Define a format for time periods;
proc format ;
   value mytime
      1 = '1992'
      2 = '1993'
      3 = 'Target for 1994'
   ;
* Simulate the data;
data Disk;
   keep Supplier Year Width;
   length Supplier $ 16;
   label  Width = 'Opening Width (inches)';
   format Year mytime. ;
   Year = 1;
   Supplier = 'Supplier A';
   avg      = 1.895 ;
   std      = 0.0027 ;
   do i = 1 to 260;
      Width = avg + std * rannor(15535); output;
   end;
   Supplier = 'Supplier B';
   avg      = 1.8983 ;
   std      = 0.0024 ;
   do i = 1 to 260;
      Width = avg + std * rannor(15535); output;
   end;
   Year = 2;
   Supplier = 'Supplier A';
   avg      = 1.8970 ;
   std      = 0.0013 ;
   do i = 1 to 260;
      Width = avg + std * rannor(15535); output;
   end;
   Supplier = 'Supplier B';
   avg      = 1.8980 ;
   std      = 0.0013 ;
   do i = 1 to 260;
      Width = avg + std * rannor(15535); output;
   end;
run;
ods graphics off;
title "Results of Supplier Training Program";
proc capability data=Disk noprint;
   specs  lsl = 1.8925
          usl = 1.9027;
   comphist Width / class      = ( Supplier Year )
                    classkey   = ('Supplier A' '1993')
                    intertile  = 1.0
                    vaxis      = 0 10 20 30
                    ncols      = 2
                    nrows      = 2;
   inset cpk (4.2) / noframe pos = n;
run;
The CLASSKEY= option specifies the key cell as the observations for which Supplier is equal to 'SUPPLIER A' and Year is equal to 2. This cell determines the binning for the other cells, and (since the NOKEYMOVE option is not specified) the
columns are interchanged so that this cell is displayed in the upper left corner. Note that if the CLASSKEY= option were not
specified, the default key cell would be the observations for which Supplier is equal to 'SUPPLIER A' and Year is equal to 1. If the CLASSKEY= option were not specified (or if the NOKEYMOVE option were specified), the column labeled
1992 would be displayed to the left of the column labeled 1993. See the entry for the CLASSKEY= option for details.
The VAXIS= option specifies the tick mark labels for the vertical axis, while NROWS=2 and NCOLS=2 specify a ![]() arrangement for the tiles. The INSET statement is used to display the capability index
arrangement for the tiles. The INSET statement is used to display the capability index ![]() for each cell. Output 5.7.1 provides evidence that both suppliers have reduced variability from 1992 to 1993.
for each cell. Output 5.7.1 provides evidence that both suppliers have reduced variability from 1992 to 1993.

