Creating a Basic Star Chart
See SHWSTR1 in the SAS/QC Sample LibraryThe following statements create the star chart shown in Figure 17.157:
symbol v = none;
title 'Variables Related to Paint Index';
proc shewhart history=paint limits=paintlim;
   xchart pindex*hour /
      nolegend
      starvertices = (thick gloss defects dust humid temp);
run;
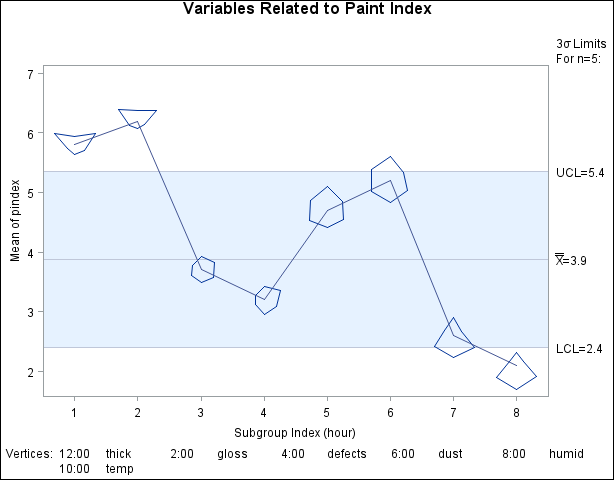
This chart is essentially an ![]() chart for paint index. However, the chart also provides information about thickness, gloss, defects, dust, humidity, and
temperature. These six variables are represented by the vertices of the stars, as indicated by the legend at the bottom of
the chart. By default, the legend uses a clock representation for the vertices; for instance, dust corresponds to the vertex
at the six o’clock position.
chart for paint index. However, the chart also provides information about thickness, gloss, defects, dust, humidity, and
temperature. These six variables are represented by the vertices of the stars, as indicated by the legend at the bottom of
the chart. By default, the legend uses a clock representation for the vertices; for instance, dust corresponds to the vertex
at the six o’clock position.
The stars are centered at the points for average paint index, and the distance from the center to a vertex represents the standardized value of the variable corresponding to the vertex. The star chart reveals that relatively high values of gloss (two o’clock) and temperature (ten o’clock) are associated with high out-of-control averages for paint index. Likewise, relatively high values of defects (four o’clock) and humidity (eight o’clock) are associated with low out-of-control averages for paint index. The star shapes reveal similarities in the data for runs 1 and 2, runs 3 and 4, runs 5 and 6, and runs 7 and 8.
Figure 17.157: A Basic Star Chart