XRCHART Statement: SHEWHART Procedure

Creating Charts for Means and Ranges from Raw Data
See SHWXR1 in the SAS/QC Sample LibraryIn the manufacture of silicon wafers, batches of five wafers are sampled, and their diameters are measured in millimeters.
The following statements create a SAS data set named Wafers, which contains the measurements for 25 batches:
data Wafers;
   input Batch @;
   do i=1 to 5;
      input Diameter @;
      output;
   end;
   drop i;
   datalines;
 1  35.00 34.99 34.99 34.98 35.00
 2  35.01 34.99 34.99 34.98 35.00
 3  34.99 35.00 35.00 35.00 35.00
 4  35.01 35.00 34.99 34.99 35.00
 5  35.00 34.99 34.98 34.99 35.00
 6  34.99 34.99 35.00 35.00 35.00
 7  35.01 34.98 35.00 35.00 34.99
 8  35.00 35.00 34.99 34.98 34.99
 9  34.99 34.98 34.98 35.01 35.00
10  34.99 35.00 35.01 34.99 35.01
11  35.01 35.00 35.00 34.98 34.99
12  34.99 34.99 35.00 34.98 35.01
13  35.01 34.99 34.98 34.99 34.99
14  35.00 35.00 34.99 35.01 34.99
15  34.98 34.99 34.99 34.98 35.00
16  34.99 35.00 35.00 35.01 35.00
17  34.98 34.98 34.99 34.99 34.98
18  35.01 35.02 35.00 34.98 35.00
19  34.99 34.98 35.00 34.99 34.98
20  34.99 35.00 35.00 34.99 34.99
21  35.00 34.99 34.99 34.98 35.00
22  35.00 35.00 35.01 35.00 35.00
23  35.02 35.00 34.98 35.02 35.00
24  35.00 35.00 34.99 35.01 34.98
25  34.99 34.99 34.99 35.00 35.00
;
The following statements use the PRINT procedure to list the data set Wafers. A portion of this listing is shown in Figure 17.104.
title 'The Data Set Wafers';
proc print data=Wafers noobs;
run;
Figure 17.104: Partial Listing of the Data Set Wafers
| The Data Set Wafers |
| Batch | Diameter |
|---|---|
| 1 | 35.00 |
| 1 | 34.99 |
| 1 | 34.99 |
| 1 | 34.98 |
| 1 | 35.00 |
| 2 | 35.01 |
| 2 | 34.99 |
| 2 | 34.99 |
| 2 | 34.98 |
| 2 | 35.00 |
| 3 | 34.99 |
| 3 | 35.00 |
| 3 | 35.00 |
| 3 | 35.00 |
| 3 | 35.00 |
The data set Wafers is said to be in “strung-out” form since each observation contains the batch number and diameter measurement for a single wafer. The first five observations
contain the diameters for the first batch, the second five observations contain the diameters for the second batch, and so
on. Because the variable Batch classifies the observations into rational subgroups, it is referred to as the subgroup-variable. The variable Diameter contains the wafer diameter measurements and is referred to as the process variable (or process for short).
You can use ![]() and R charts to determine whether the manufacturing process is in control. The following statements create the
and R charts to determine whether the manufacturing process is in control. The following statements create the ![]() and R charts shown in Figure 17.105:
and R charts shown in Figure 17.105:
ods graphics off;
title 'Mean and Range Charts for Diameters';
proc shewhart data=Wafers;
   xrchart Diameter*Batch;
run;
This example illustrates the basic form of the XRCHART statement. After the keyword XRCHART, which specifies the type of control
chart to display, you specify the process to analyze (in this case, Diameter) followed by an asterisk and the subgroup-variable (Batch).
The input data set is specified with the DATA= option in the PROC SHEWHART statement. By default, traditional graphics output is produced, and its appearance is governed by the style in effect for any given ODS destination. Note that the STATISTICAL style is used throughout this book. See Chapter 3: SAS/QC Graphics, for a discussion of alternatives for producing graphics with SAS/QC procedures.
Figure 17.105: ![]() and R Charts for Wafer Diameter Data (Traditional Graphics)
and R Charts for Wafer Diameter Data (Traditional Graphics)
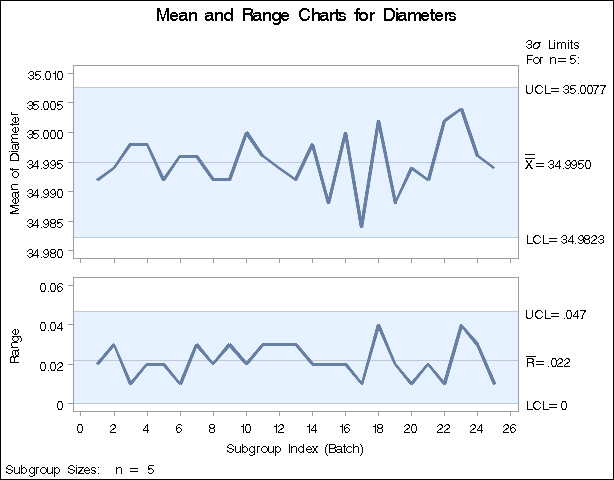
Each point on the ![]() chart represents the average (mean) of the measurements for a particular batch. For instance, the mean plotted for the first
batch is
chart represents the average (mean) of the measurements for a particular batch. For instance, the mean plotted for the first
batch is
|
|
Each point on the R chart represents the range of the measurements for a particular batch. For instance, the range plotted for the first batch is 35.00 – 34.98 = 0.02.
By default, the control limits shown are ![]() limits estimated from the data; the formulas for the limits are given in Table 17.72. You can also read control limits from an input data set; see Reading Preestablished Control Limits.
limits estimated from the data; the formulas for the limits are given in Table 17.72. You can also read control limits from an input data set; see Reading Preestablished Control Limits.
Since all the points lie within the control limits, it can be concluded that the process is in statistical control. For computational details, see Constructing Charts for Means and Ranges. For more details on reading raw data, see DATA= Data Set.