The RELIABILITY Graphical Interface
An experimental graphical interface for the RELIABILITY procedure is implemented using FRAME entries in SAS/AF software. The
application is available as a SAS/QC sample library program and is stored in the reliab catalog. (File extensions for SAS catalogs differ based on the operating system.)
Assume that you are using the SAS System under Microsoft Windows and that the SAS/QC sample library is stored in the c:\sas\qc\sample directory. (Check with your SAS site representative for the location of the SAS/QC sample library on your system.) You invoke
the RELIABILITY application as follows:
-
First, for SAS 9.3 and later releases, you must enter the following statements to ensure proper operation of the RELIABILITY application:
ods graphics off;
ods html close;
ods listing;
-
Next you must tell the SAS System where the catalog is stored:
libname rel 'c:\sas\qc\sample';
-
You then issue the following command from any SAS display manager window:
af c=rel.reliab.reliab.frame aws=no
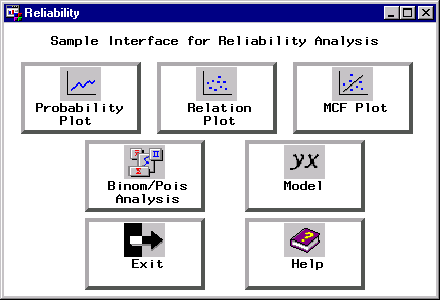
The main application window appears, as shown in Figure B.1. You select a type of analysis from the main window. For example, you can select a probability plot by clicking the Probability Plot button.
Figure B.1: Main Window
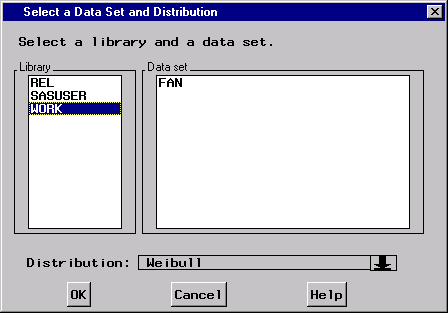
The next window to appear enables you to select the SAS data set that contains your data. You also specify a probability distribution
for the probability plot and associated analysis. In Figure B.2, the data set WORK.FAN that contains the data for the engine fan example (see the section Analysis of Right-Censored Data from a Single Population in Chapter 16: The RELIABILITY Procedure,) is selected, and the Weibull distribution is specified.
Figure B.2: Data Set and Distribution Window
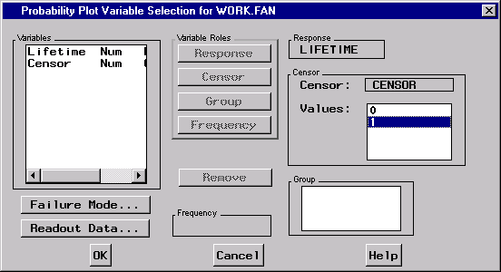
Click the OK button, and the variable selection screen shown in Figure B.3 appears. The variable LIFETIME from the input data set is selected in Figure B.3 as the response variable, and the variable CENSOR is selected as the censoring indicator, with a value of 1 indicating censored lifetimes.
Figure B.3: Variable Selection Window
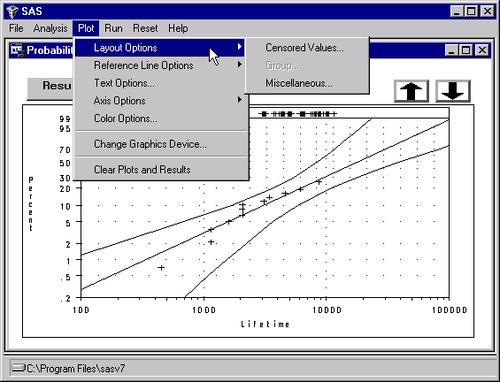
Clicking the OK button produces the probability plot window shown in Figure B.4. The RESULTS button enables you to view the tabular output from the RELIABILITY procedure.
You can choose procedure options and other analyses by selecting one of the menus at the top of the plot window. For example, you can specify additional plot options by selecting the plot menu, as shown in Figure B.5.
Figure B.4: Probability Plot Window
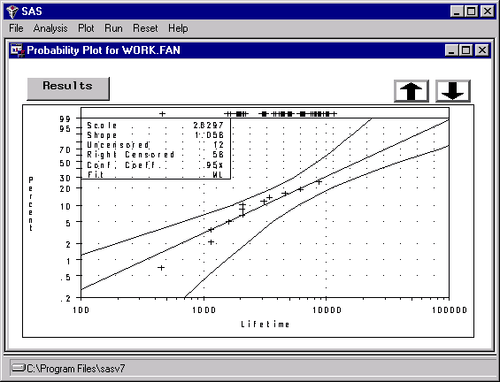
Figure B.5: Probability Plot Window