Customizing Labels and Formatting Values
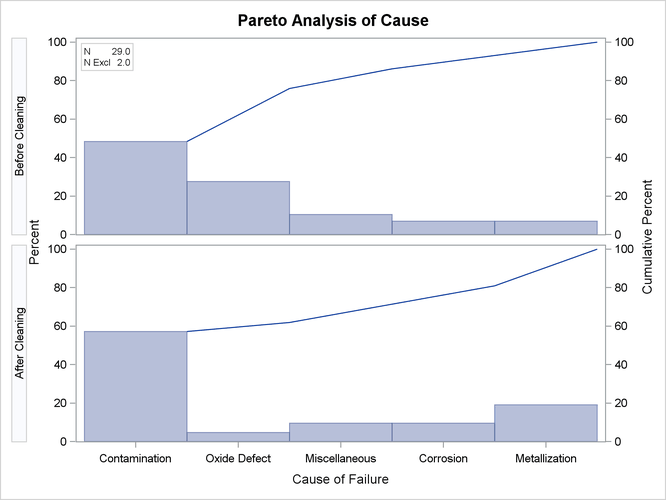
By default, each inset statistic is identified with an appropriate label, and each numeric value is printed using an appropriate format. However, you may want to provide your own labels and formats. For example, in Figure 15.12 the default label used for the NEXCL statistic is rather long. The following statements produce a comparative Pareto chart with insets using a shorter label for the number of excluded observations. A format with one decimal place is also specified for each statistic. (These are integer values—the decimals are added only to demonstrate this feature.) Note that a single INSET statement produces an inset in each cell of the comparative Pareto chart.
ods graphics on;
proc pareto data=Failure3;
   vbar Cause /
      class    = Stage
      freq     = Counts
      maxncat  = 5
      classkey = 'Before Cleaning';
   inset n (4.1) nexcl='N Excl' (3.1);
run;
The ODS GRAPHICS ON statement specified before the PROC PARETO statement enables ODS Graphics, so the Pareto chart is created using ODS Graphics instead of traditional graphics.
The resulting chart is displayed in Figure 15.13. You can provide your own label by specifying the keyword for that statistic followed by an equal sign (=) and the label in quotes. The label can have up to 24 characters.
The format 4.1 specified in parentheses after the N keyword displays the statistics with a field width of four and one decimal place. In general, you can specify any numeric SAS format in parentheses after an inset keyword. You can also specify a format to be used for all the statistics in the INSET statement with the FORMAT= option. For more information about SAS formats, refer to SAS Formats and Informats: Reference.
Note that if you specify both a label and a format for a statistic, the label must appear before the format.
Figure 15.13: Customizing Labels and Formatting Values in an Inset