EWMACHART Statement: MACONTROL Procedure

Reading Preestablished Control Limit Parameters
See MACEW1 in the SAS/QC Sample LibraryIn the previous example, the OUTLIMITS= data set saved the control limit parameters in the data set Cliplim. This example shows how to apply these parameters to new data provided in the following data set:
data Clips1a;
   label Gap='Gap Measurement (mm)';
   input Day @;
   do i=1 to 5;
      input Gap @;
      output;
   end;
   drop i;
   datalines;
21  14.86 15.01 14.67 14.67 15.07
22  14.93 14.53 15.07 15.10 14.98
23  15.27 14.90 15.12 15.10 14.80
24  15.02 15.21 14.93 15.11 15.20
25  14.90 14.81 15.26 14.57 14.94
26  14.78 15.29 15.13 14.62 14.54
27  14.78 15.15 14.61 14.92 15.07
28  14.92 15.31 14.82 14.74 15.26
29  15.11 15.04 14.61 15.09 14.68
30  15.00 15.04 14.36 15.20 14.65
31  14.99 14.76 15.18 15.04 14.82
32  14.90 14.78 15.19 15.06 15.06
33  14.95 15.10 14.86 15.27 15.22
34  15.03 14.71 14.75 14.99 15.02
35  15.38 14.94 14.68 14.77 14.83
36  14.95 15.43 14.87 14.90 15.34
37  15.18 14.94 15.32 14.74 15.29
38  14.91 15.15 15.06 14.78 15.42
39  15.34 15.34 15.41 15.36 14.96
40  15.12 14.75 15.05 14.70 14.74
;
The following statements create an EWMA chart for the data in Clips1a using the control limit parameters in Cliplim:
ods graphics on;
title 'EWMA Chart for Second Set of Gap Measurements';
proc macontrol data=Clips1a limits=Cliplim;
   ewmachart Gap*Day / odstitle=title markers;
run;
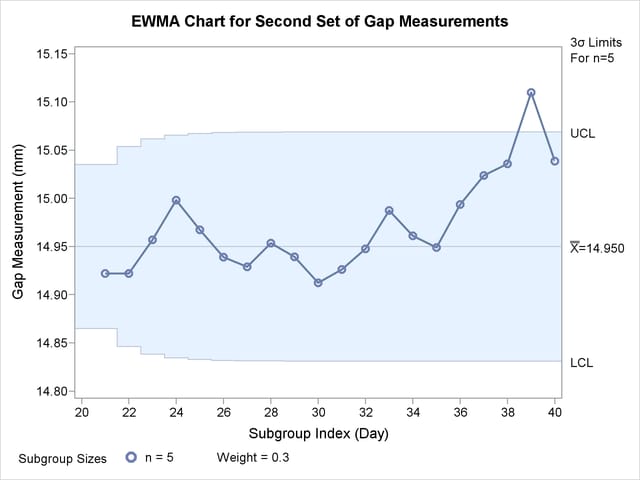
The ODS GRAPHICS ON statement specified before the PROC MACONTROL statement enables ODS Graphics, so the EWMA chart is created using ODS Graphics instead of traditional graphics. The chart is shown in Figure 9.9.
Figure 9.9: EWMA Chart Using Preestablished Control Limit Parameters
The LIMITS= option in the PROC MACONTROL statement specifies the data set containing the control limit parameters. By default,[42] this information is read from the first observation in the LIMITS= data set for which
-
the value of
_VAR_matches the process nameGap -
the value of
_SUBGRP_matches the subgroup-variable nameDay
Note that the EWMA plotted for the ![]() th day lies above the upper control limit, signalling an out-of-control process.
th day lies above the upper control limit, signalling an out-of-control process.
In this example, the LIMITS= data set was created in a previous run of the MACONTROL procedure. You can also create a LIMITS= data set with the DATA step. See LIMITS= Data Set for details concerning the variables that you must provide, and see Example 9.1 for an illustration.
[42] In SAS 6.09 and in earlier releases, it is also necessary to specify the READLIMITS option to read control limits from a LIMITS= data set.