INSET Statement: CAPABILITY Procedure

Adding a Header and Positioning the Inset
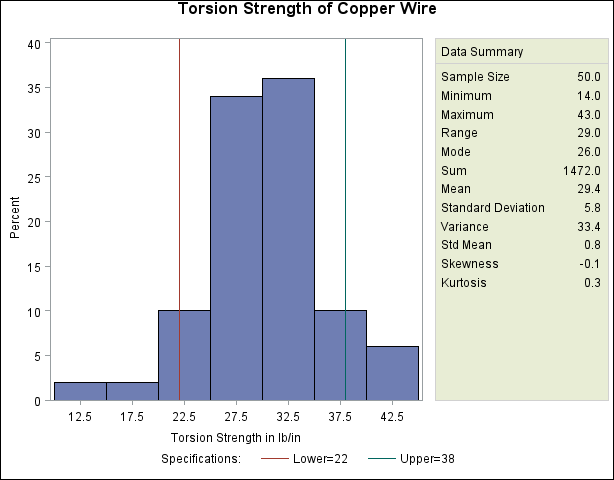
See CAPINS1 in the SAS/QC Sample LibraryIn the previous examples, the inset is displayed in the upper left corner of the plot, the default position for insets added to histograms. You can control the inset position with the POSITION= option. In addition, you can display a header at the top of the inset with the HEADER= option. The following statements create the chart shown in Figure 5.19:
ods graphics off;
title 'Torsion Strength of Copper Wire';
proc capability data=Wire noprint;
   spec lsl=22 usl=38;
   histogram Strength;
   inset n='Sample Size' min max range mode sum mean
      std='Standard Deviation' var stdmean skewness
      kurtosis / format = 6.1
                 pos    = rm
                 header = 'Data Summary' cfill = ywh;
run;
The header (in this case, Data Summary) can be up to 40 characters. Note that a long list of inset statistics is requested. Consequently, POSITION=RM is specified to position the inset in the right margin. For more information about positioning, see Details: INSET Statement. Also note that the FORMAT= option is used to format all inset statistics. The options, such as HEADER=, POSITION=, and FORMAT=, are specified after the slash (/) in the INSET statement. For more details on INSET statement options, see Dictionary of Options.
Figure 5.19: Adding a Header and Repositioning the Inset