Displaying Summary Statistics on an ANOM Chart
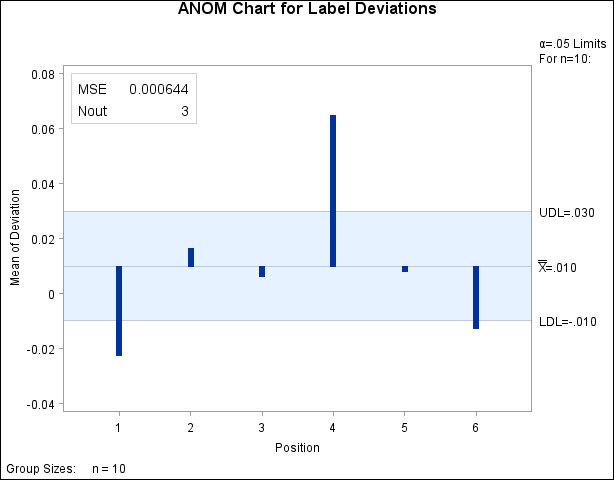
See ANMIN1 in the SAS/QC Sample LibraryA manufacturing engineer carries out a study to determine the source of excessive variation in the positioning of labels on shampoo bottles. [5] A labeling machine removes bottles from the line, attaches the labels, and returns the bottles to the line. There are six positions on the machine, and the engineer suspects that one or more of the position heads might be faulty.
A sample of 60 bottles, 10 per position, is run through the machine. For each bottle, the deviation of each label is measured
in millimeters, and the machine position is recorded. The following statements create a SAS data set named LabelDeviations, which contains the deviation measurements for the 60 bottles:
data LabelDeviations;
   input Position @;
   do i = 1 to 5;
      input Deviation @;
      output;
   end;
   drop i;
   datalines;
1  -0.02386  -0.02853  -0.03001  -0.00428  -0.03623
1  -0.04222  -0.00144  -0.06466   0.00944  -0.00163
2  -0.02014  -0.02725   0.02268  -0.03323   0.03661
2   0.04378   0.05562   0.00977   0.05641   0.01816
3  -0.00728   0.02849  -0.04404  -0.02214  -0.01394
3   0.04855   0.03566   0.02345   0.01339  -0.00203
4   0.06694   0.10729   0.05974   0.06089   0.07551
4   0.03620   0.05614   0.08985   0.04175   0.05298
5   0.03677   0.00361   0.03736   0.01164  -0.00741
5   0.02495  -0.00803   0.03021  -0.00149  -0.04640
6   0.00493  -0.03839  -0.02037  -0.00487  -0.01202
6   0.00710  -0.03075   0.00167  -0.02845  -0.00697
;
The following statements generate an ANOM chart from the LabelDeviations data. An INSET statement is used to display the mean square error (MSE) and the number of groups outside of the decision
limits (NOUT) on the chart:
ods graphics off;
title 'ANOM Chart for Label Deviations';
proc anom data=LabelDeviations;
   xchart Deviation*Position;
   inset mse nout /
      height = 3;
run;
The resulting ANOM chart is displayed in Figure 4.28. The INSET statement immediately follows the chart statement that creates the graphical display (in this case, the XCHART statement). Specify the keywords for inset statistics (such as ALPHA) immediately after the word INSET. The inset statistics appear in the order in which you specify the keywords. The HEIGHT= option on the INSET statement specifies the text height used to display the statistics in the inset.
A complete list of keywords that you can use with the INSET statement is provided in Summary of INSET Keywords. Note that the set of keywords available for a particular display may depend on both the chart statement that precedes the INSET statement and the options that you specify in the chart statement.
Figure 4.28: An ANOM Chart with an Inset
The following examples illustrate options commonly used for enhancing the appearance of an inset.