| Standard Tests for Special Causes |
The SHEWHART procedure provides eight standard tests for special causes, also referred to as rules for lack of control, supplementary rules, runs tests, runs rules, pattern tests, and Western Electric rules. These tests improve the sensitivity of the Shewhart chart to small changes in the process. 1 You can also improve the sensitivity of the chart by increasing the rate of sampling, increasing the subgroup sample size, and using control limits that represent less than three standard errors of variation from the central line. However, increasing the sampling rate and sample size is often impractical, and tightening the control limits increases the chances of falsely signaling an out-of-control condition. By detecting particular nonrandom patterns in the points plotted on the chart, the tests can provide greater sensitivity and useful diagnostic information while incurring a reasonable probability of a false signal.
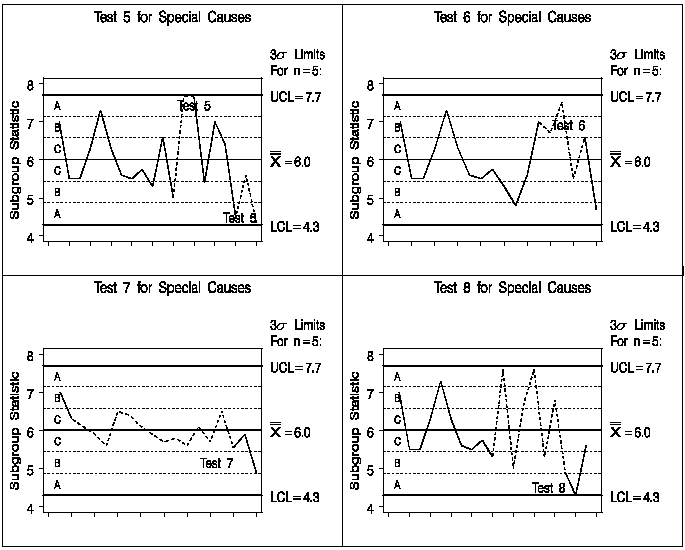
The patterns detected by the eight standard tests are defined in Table 15.92 and Table 15.93, and they are illustrated in Figure 15.179 and Figure 15.180. All eight tests were developed for use with fixed  limits. The tests are indexed according to the numbering sequence used by Nelson (1984, 1985). You can request any combination of the eight tests by specifying the test indexes with the TESTS= option in the BOXCHART, CCHART, IRCHART, MCHART, MRCHART, NPCHART, PCHART, UCHART, XCHART, XRCHART, and XSCHART statements.
The following restrictions apply to the tests:
Only Tests 1, 2, 3, and 4 are recommended for
 charts,
  charts,
  charts, and
  charts created with the CCHART, NPCHART, PCHART, and UCHART statements, respectively. In these four cases, Test 2 should not be used unless the process distribution is symmetric or nearly symmetric.
 By default, the TESTS= option is not applied with control limits that are not
limits or that vary with subgroup sample size. You can use the NO3SIGMACHECK option to request tests for special causes when the SIGMAS= option specifies control limits other than limits. This is not recommended for standard control chart applications, since the standard tests for special causes are based on limits. You can apply tests for special causes when control limits vary with subgroup sample size by using the LIMITN= or TESTNMETHOD= options (see Requesting Standard Tests and Applying Tests with Varying Subgroup Sample Sizes).
Test Index |
Pattern Description |
|---|---|
1 |
One point beyond Zone A (outside the control limits) |
2 |
Nine points in a row in Zone C or beyond on one side of the central line (see Note 1 below) |
3 |
Six points in a row steadily increasing or steadily decreasing (see Note 2 below) |
4 |
Fourteen points in a row alternating up and down |
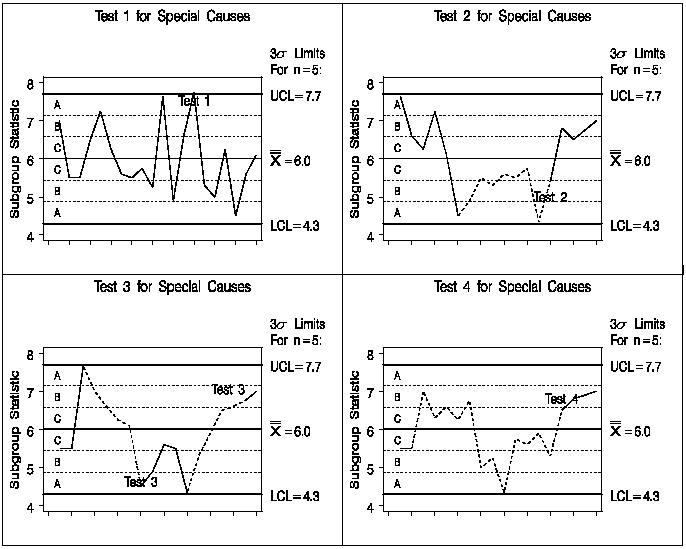
Notes:
The number of points in Test 2 can be specified as 7, 8, 9, 11, 14, or 20 with the TEST2RUN= option.
The number of points in Test 3 can be specified as 6, 7, or 8 with the TEST3RUN= option.
Test Index |
Pattern Description |
|---|---|
5 |
Two out of three points in a row in Zone A or beyond |
6 |
Four out of five points in a row in Zone B or beyond |
7 |
Fifteen points in a row in Zone C on either or both sides of the central line |
8 |
Eight points in a row on either or both sides of the central line with no points in Zone C |
- Requesting Standard Tests
- Interpreting Standard Tests for Special Causes
- Modifying Standard Tests for Special Causes
- Applying Tests with Varying Subgroup Sample Sizes
- Labeling Signaled Points with a Variable
- Applying Tests with Multiple Phases
- Applying Tests with Multiple Sets of Control Limits
- Enhancing the Display of Signaled Tests