XRCHART Statement: SHEWHART Procedure

Example 15.38 Applying Tests for Special Causes
[See SHWXR2 in the SAS/QC Sample Library]This example illustrates how you can apply tests for special causes to make  and
and  charts more sensitive to special causes of variation.
The weight of a roll of tape is measured before and after an adhesive is applied. The difference in weight represents the amount of adhesive applied to the tape during the coating process. The following data set contains the average and the range of the adhesive amounts for 21 samples of five rolls:
data Tape;
   input Sample $ WeightX WeightR;
   WeightN=5;
   label WeightX = 'Average Adhesive Amount'
         Sample  = 'Sample Code';
   datalines;
C9  1270  35
C4  1258  25
A7  1248  24
A1  1260  39
A5  1273  29
D3  1260  21
D6  1259  37
D1  1240  37
R4  1260  28
H7  1255  19
H2  1268  36
H6  1253  36
P4  1273  29
P9  1275  22
J7  1257  24
J2  1269  41
J3  1249  36
B2  1264  31
G4  1258  25
G6  1248  36
G3  1248  30
;
The following statements create and charts, apply several tests to the chart, and tabulate the results:
title 'Tests for Special Causes Applied to Adhesive Tape Data';
ods graphics on;
proc shewhart history=Tape;
   xrchart Weight*Sample / tests    = 1 to 5
                           odstitle = title
                           tabletests
                           zonelabels;
run;
title 'Tests for Special Causes Applied to Adhesive Tape Data';
proc shewhart history=Tape;
   xrchart Weight*Sample / tests    = 1 to 5
                           odstitle = title
                           tabletests
                           nochart
                           zonelabels;
run;
The charts are shown in Output 15.38.1, and the table is shown in Output 15.38.2. The TESTS= option requests Tests 1, 2, 3, 4, and 5, which are described in Tests for Special Causes: SHEWHART Procedure. The TABLETESTS option requests a basic table of subgroup statistics and control limits with a column indicating which subgroups tested positive for special causes.
The ZONELABELS option displays zone lines and zone labels on the chart. The zones are used to define the tests.
and Charts
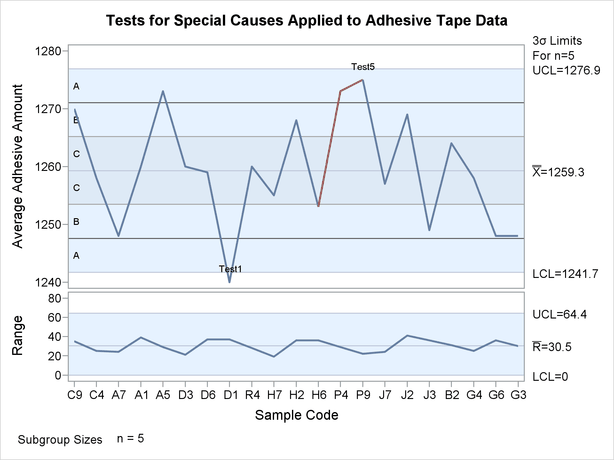
Output 15.38.1 and Output 15.38.2 indicate that Test 1 is positive at sample D1 and Test 5 is positive at sample P9. Test 1 detects one point beyond Zone A (outside the control limits), and Test 5 detects two out of three points in a row in Zone A or beyond.
and Charts
| Tests for Special Causes Applied to Adhesive Tape Data |
| Means and Ranges Chart Summary for Weight | ||||||||
|---|---|---|---|---|---|---|---|---|
| Sample | Subgroup Sample Size |
3 Sigma Limits with n=5 for Mean | Special Tests Signaled |
3 Sigma Limits with n=5 for Range |
||||
| Lower Limit |
Subgroup Mean |
Upper Limit |
Lower Limit |
Subgroup Range |
Upper Limit |
|||
| C9 | 5 | 1241.7065 | 1270.0000 | 1276.8650 | 0 | 35.000000 | 64.441879 | |
| C4 | 5 | 1241.7065 | 1258.0000 | 1276.8650 | 0 | 25.000000 | 64.441879 | |
| A7 | 5 | 1241.7065 | 1248.0000 | 1276.8650 | 0 | 24.000000 | 64.441879 | |
| A1 | 5 | 1241.7065 | 1260.0000 | 1276.8650 | 0 | 39.000000 | 64.441879 | |
| A5 | 5 | 1241.7065 | 1273.0000 | 1276.8650 | 0 | 29.000000 | 64.441879 | |
| D3 | 5 | 1241.7065 | 1260.0000 | 1276.8650 | 0 | 21.000000 | 64.441879 | |
| D6 | 5 | 1241.7065 | 1259.0000 | 1276.8650 | 0 | 37.000000 | 64.441879 | |
| D1 | 5 | 1241.7065 | 1240.0000 | 1276.8650 | 1 | 0 | 37.000000 | 64.441879 |
| R4 | 5 | 1241.7065 | 1260.0000 | 1276.8650 | 0 | 28.000000 | 64.441879 | |
| H7 | 5 | 1241.7065 | 1255.0000 | 1276.8650 | 0 | 19.000000 | 64.441879 | |
| H2 | 5 | 1241.7065 | 1268.0000 | 1276.8650 | 0 | 36.000000 | 64.441879 | |
| H6 | 5 | 1241.7065 | 1253.0000 | 1276.8650 | 0 | 36.000000 | 64.441879 | |
| P4 | 5 | 1241.7065 | 1273.0000 | 1276.8650 | 0 | 29.000000 | 64.441879 | |
| P9 | 5 | 1241.7065 | 1275.0000 | 1276.8650 | 5 | 0 | 22.000000 | 64.441879 |
| J7 | 5 | 1241.7065 | 1257.0000 | 1276.8650 | 0 | 24.000000 | 64.441879 | |
| J2 | 5 | 1241.7065 | 1269.0000 | 1276.8650 | 0 | 41.000000 | 64.441879 | |
| J3 | 5 | 1241.7065 | 1249.0000 | 1276.8650 | 0 | 36.000000 | 64.441879 | |
| B2 | 5 | 1241.7065 | 1264.0000 | 1276.8650 | 0 | 31.000000 | 64.441879 | |
| G4 | 5 | 1241.7065 | 1258.0000 | 1276.8650 | 0 | 25.000000 | 64.441879 | |
| G6 | 5 | 1241.7065 | 1248.0000 | 1276.8650 | 0 | 36.000000 | 64.441879 | |
| G3 | 5 | 1241.7065 | 1248.0000 | 1276.8650 | 0 | 30.000000 | 64.441879 | |