IRCHART Statement: SHEWHART Procedure

Specifying the Computation of the Moving Range
[See SHWIR1 in the SAS/QC Sample Library]By default, the IRCHART statement uses two consecutive measurements to calculate moving ranges. However, you can specify a different number of measurements to use, as illustrated by the following statements:
ods graphics on;
title 'Specifying the Computation of the Moving Range';
proc shewhart data=Jets;
   irchart Diam*Engine / limitn=3 odstitle=title;
run;
The ODS GRAPHICS ON statement specified before the PROC SHEWHART statement enables ODS Graphics, so the charts are created by using ODS Graphics instead of traditional graphics. The LIMITN= option specifies the number of consecutive measurements used to compute the moving ranges. The resulting charts are shown in Figure 15.34.
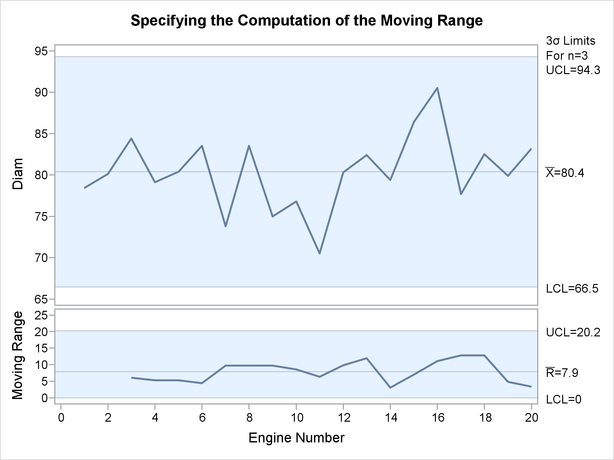
Note that the LIMITN= value is displayed in the legend above the control limit labels. The charts indicate that the process is in control, since all the points lie within the control limits.