| Parametric Model for Interval Recurrent Events Data |
Byar (1980) provides data for recurrences of bladder tumors in patients in a clinical trial. Figure 14.49 is a partial listing of data for 86 patients, of which 48 were given a placebo and 38 were treated with the drug Thiotepa. The data are here grouped into one month intervals.
| Obs | Group | Age | Age1 | N | R |
|---|---|---|---|---|---|
| 1 | Placebo | 0 | 1 | 48 | 0 |
| 2 | Placebo | 1 | 2 | 47 | 0 |
| 3 | Placebo | 2 | 3 | 46 | 1 |
| 4 | Placebo | 3 | 4 | 46 | 4 |
| 5 | Placebo | 4 | 5 | 46 | 7 |
| 6 | Placebo | 5 | 6 | 45 | 0 |
| 7 | Placebo | 6 | 7 | 45 | 2 |
| 8 | Placebo | 7 | 8 | 45 | 4 |
| 9 | Placebo | 8 | 9 | 44 | 1 |
| 10 | Placebo | 9 | 10 | 44 | 2 |
| 11 | Placebo | 10 | 11 | 44 | 4 |
| 12 | Placebo | 11 | 12 | 42 | 2 |
| 13 | Placebo | 12 | 13 | 42 | 1 |
| 14 | Placebo | 13 | 14 | 42 | 4 |
| 15 | Placebo | 14 | 15 | 42 | 1 |
| 16 | Placebo | 15 | 16 | 41 | 1 |
| 17 | Placebo | 16 | 17 | 41 | 5 |
| 18 | Placebo | 17 | 18 | 41 | 4 |
| 19 | Placebo | 18 | 19 | 41 | 4 |
| 20 | Placebo | 19 | 20 | 38 | 1 |
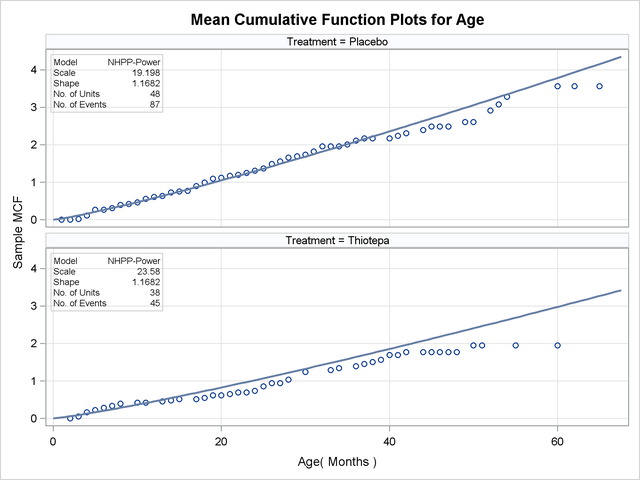
The following SAS statements fit a nonhomogeneous Poisson process model with a power intensity function to the interval recurrence data. Some patients were lost to follow-up in each month, so the number of patients observed changes from month to month. The variable N provides the number of patients available at the beginning of each month and assumed to be observed throughout the month. The variable R is the number of recurrences of tumors in each month. Age represents the number of months after randomization into the trial (starting with month 0), and Age1=Age+1 is the end of a month. The variable Group represents the treatment, either Placebo or Thiotepa. The MODEL statement requests a maximum likelihood fit of the model with Group as a classification variable. The MCFPLOT statement requests a plot of the fitted model and nonparametric estimates of the mean cumulative function for each group.
proc reliability data=Tumor;
   distribution nhpp(pow);
   freq R;
   nenter N;
   class Group;
   model  (Age Age1) = Group;
   mcfplot(Age Age1) = Group / fit=model noconf;
run;
The resulting maximum likelihood parameter estimates are shown in Figure 14.50.
| NHPP-Power Parameter Estimates | |||||
|---|---|---|---|---|---|
| Parameter | Estimate | Standard Error | Asymptotic Normal | ||
| 95% Confidence Limits | |||||
| Lower | Upper | ||||
| Intercept | 23.5802 | 3.1567 | 17.3932 | 29.7671 | |
| Group | Placebo | -4.3826 | 3.4873 | -11.2175 | 2.4523 |
| Group | Thiotepa | 0.0000 | 0.0000 | 0.0000 | 0.0000 |
| Shape | 1.1682 | 0.0960 | 0.9945 | 1.3723 | |
Nonparametric estimates of the mean cumulative function are plotted as points, and the fitted model is plotted as the solid line in Figure 14.51.
