ODS Graphics
The following SAS/QC procedures support ODS Graphics:
ANOM
CAPABILITY
CUSUM
MACONTROL
MVPMODEL
MVPMONITOR
PARETO
RELIABILITY
SHEWHART
ODS Graphics provides the highest quality graphical output available from SAS/QC procedures. It is unaffected by global graphics statements, procedure options for controlling traditional graphics, and the GSTYLE system option. See Chapter 21, Statistical Graphics Using ODS (SAS/STAT User's Guide), for a thorough discussion of ODS Graphics. Note: In SAS 9.3 the ANOM, CUSUM, MACONTROL, and SHEWHART procedures do not support the creation of graphs that are editable with the ODS Graphics Editor.
The following statements produce a histogram of the variable Thickness, which is discussed in the previous section. Here, the ODS GRAPHICS statement is specified to request ODS Graphics.
ods listing style=htmlblue;
ods graphics on;
proc capability data=Trans noprint;
   spec lsl = 3.45 usl = 3.55 cleft cright;
   histogram Thickness;
run;
Figure 3.5 shows the ODS Graphics version of the histogram. Note that fonts, colors, and other attributes are determined by the HTMLBLUE style. Options for specifying these attributes (as used, for example, in the statements that produced Figure 3.4) are not applicable with ODS Graphics and are ignored when you use the ODS GRAPHICS statement.
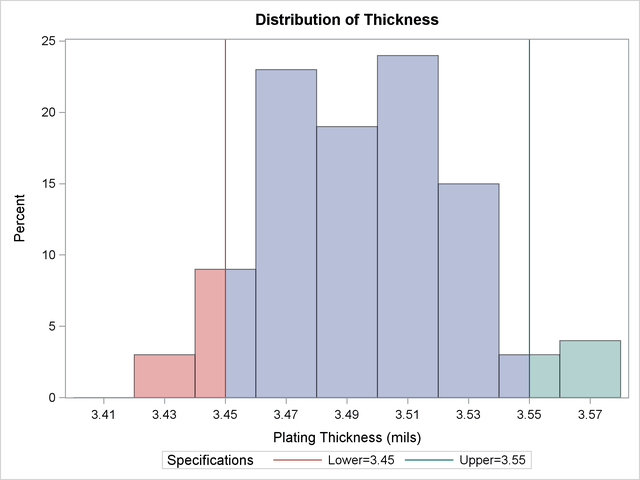
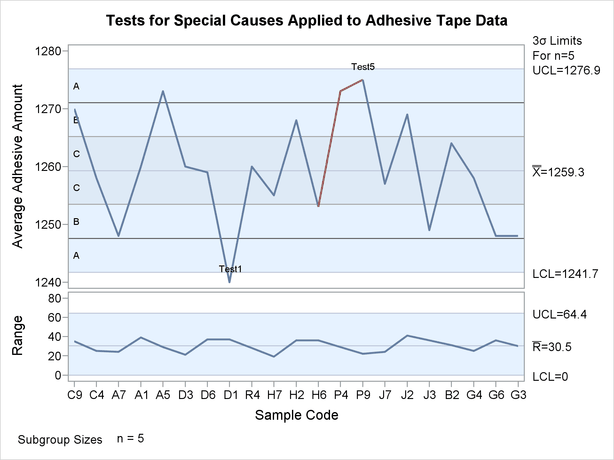
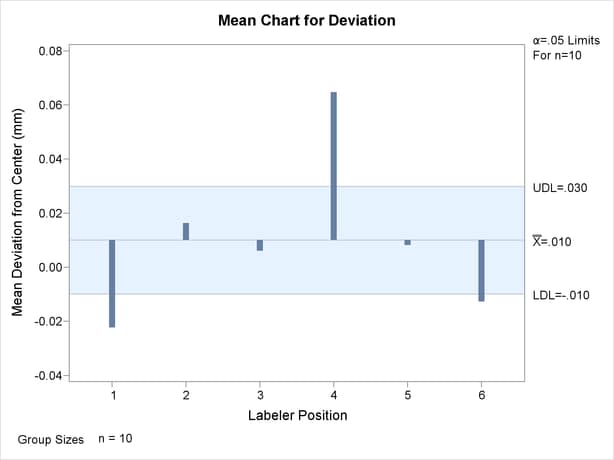
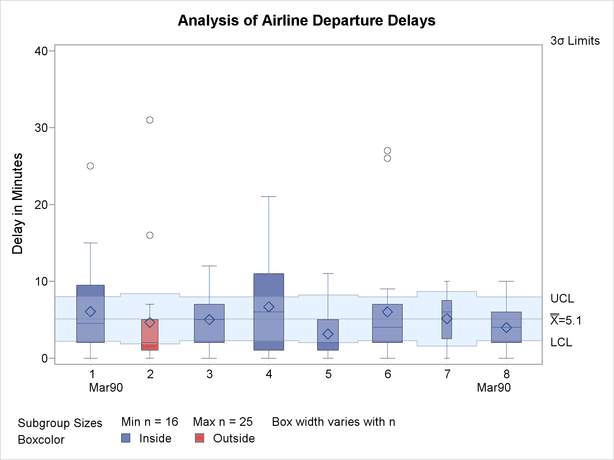
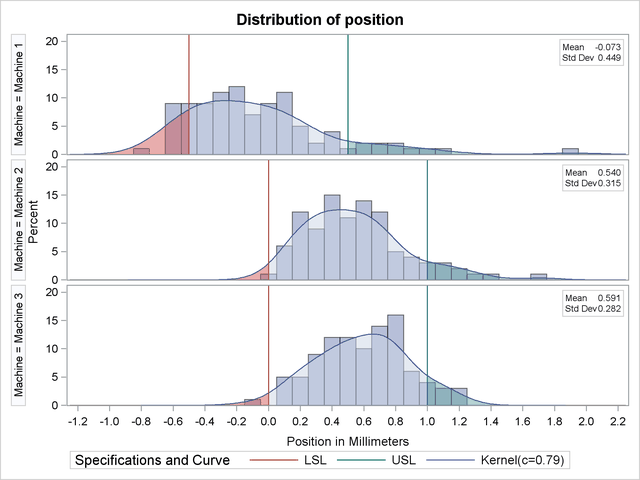
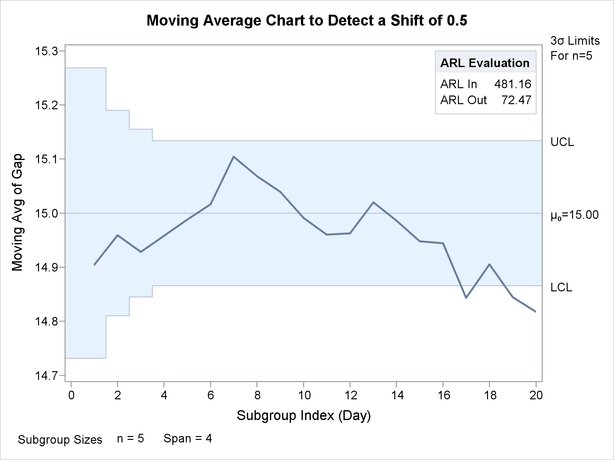
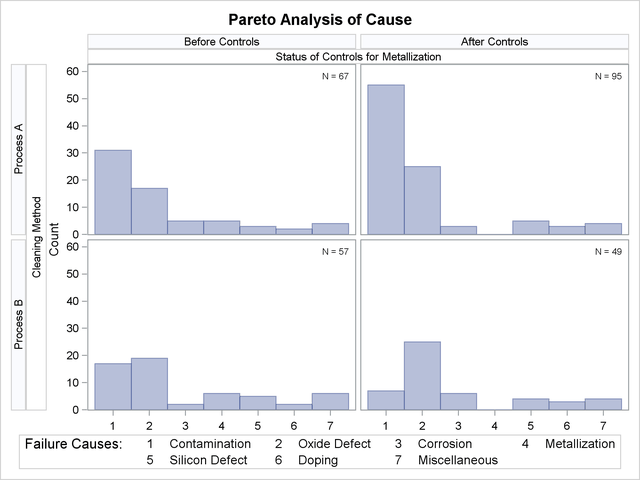
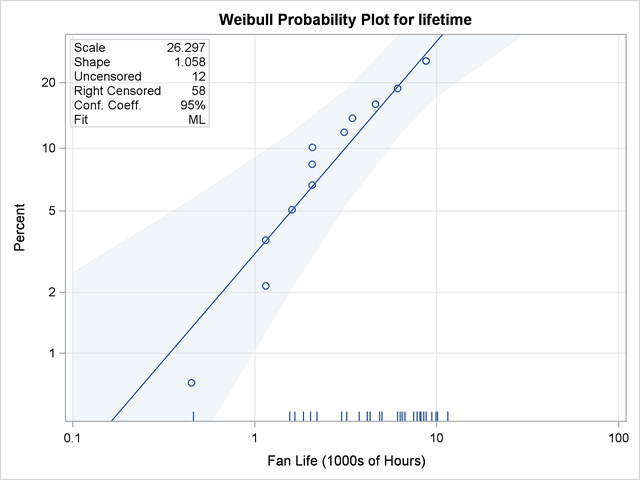
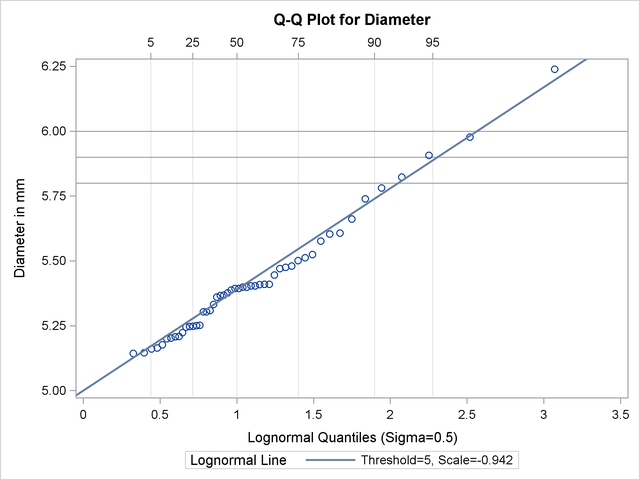
Figure 3.6 through Figure 3.13 show examples of ODS Graphics output produced by SAS/QC procedures. These graphs were all created with the HTMLBLUE style.
 and
and  Chart (SHEWHART)
