EWMACHART Statement: MACONTROL Procedure

Example 9.2 Displaying Limits Based on Asymptotic Values
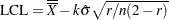
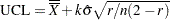
[See MACEW3 in the SAS/QC Sample Library]The upper (lower) control limits in Output 9.1.1 are monotonically increasing (decreasing). As the number of subgroups increases, the control limits approach the following asymptotic values:
 |
 |
These constant limits are displayed if you specify the ASYMPTOTIC option, as illustrated by the following statements:
ods graphics off;
title 'Constant Control Limits Based on Asymptotic Values';
proc macontrol data=Clips1;
   ewmachart Gap*Day /
       mu0     = 15
       sigma0  = 0.2
       weight  = 0.3
       asymptotic
       xsymbol = mu0;
run;
The chart is shown in Output 9.2.1.
Output 9.2.1
Asymptotic Control Limits
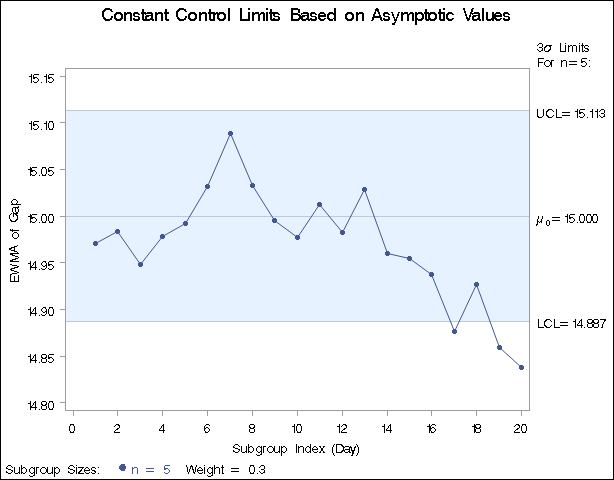
Note that the same three points that were outside the exact limits (displayed in Output 9.1.1) fall outside the asymptotic limits. The exact limits quickly approach the asymptotic values, so only the first few subgroups have appreciably different limits.