UCHART Statement: ANOM Procedure

Creating ANOM Charts for Rates from Group Counts
[See ANMU1 in the SAS/QC Sample Library]A health care system administrator uses ANOM to compare medical/surgical admissions rates for set of clinics. For more background concerning this application, refer to Rodriguez (1996).
The following statements create a SAS data set named MSAdmits, which contains the number of admissions and the number of member-months for each clinic during a one-year period.
data MSAdmits;
   length ID $ 2;
   input ID Count MemberMonths @@;
   KMemberYrs = MemberMonths/12000;
   label ID = 'Medical Group Id Number';
   datalines;
1A   1882    697204 1K    600    224715 1B    438    154720
1D    318     82254 3M    183     76450 3I    220     73529
1N    121     60169 3H    105     52886 1Q    124     52595
1E    171     51229 3B     88     34775 1C    100     31959
1H    112     28782 3C     84     27478 1R     69     26494
1T     21     25096 1M    130     24723 1O     61     24526
3D     66     22359 1J     54     19101 3J     30     16089
3G     36     13851 3E     26     10587 1G     28     10351
1I     25      6041 1L     20      5138 1S      7      2723
1F      7      2424 1P      2      2030
;
proc sort data=MSAdmits;
   by ID;
run;
A partial listing of MSAdmits is shown in Figure 4.17.
| Medical/Surgical Admissions |
| ID | Count | MemberMonths | KMemberYrs |
|---|---|---|---|
| 1A | 1882 | 697204 | 58.1003 |
| 1B | 438 | 154720 | 12.8933 |
| 1C | 100 | 31959 | 2.6633 |
| 1D | 318 | 82254 | 6.8545 |
| 1E | 171 | 51229 | 4.2691 |
| 1F | 7 | 2424 | 0.2020 |
| 1G | 28 | 10351 | 0.8626 |
| 1H | 112 | 28782 | 2.3985 |
| 1I | 25 | 6041 | 0.5034 |
| 1J | 54 | 19101 | 1.5918 |
There is a single observation per clinic. The variable ID identifies the clinics and is referred to as the group-variable. The variable Count provides the number of admissions for each clinic, which is referred to as the response variable (or response for short). The variable MemberMonths, which provides the number of member-months for each clinic, is divided by 1200 to compute the variable KMemberYrs, the number of 1000-member-years, which serves as the measure of opportunity for an admission to occur.
The following example illustrates the basic form of the UCHART statement. After the keyword UCHART, you specify the response to analyze (in this case, Count), followed by an asterisk and the group-variable (ID).
The following statements create the  chart shown in Figure 4.18:
ods graphics off;
title 'Analysis of Medical/Surgical Admissions';
proc anom data=MSAdmits;
   uchart Count*ID / groupn = KMemberYrs
                     turnhlabels
                     nolegend;
   label Count = 'Admits per 1000 Member Years';
run;
The TURNHLABELS option is used to vertically display the horizontal axis labels. The GROUPN= option specifies the number of "occurrence opportunity" units in each group and is required if the input data set is a DATA= data set. In this example, 1000 member years represent one unit of opportunity. The number of units per group can be thought of as the group "sample size." You can use the GROUPN= option to specify one of the following:
a constant number of units, which applies to all the groups
an input variable name, which provides the number of units for each group (KMemberYrs in this example)
Options such as GROUPN= are specified after the slash (/) in the UCHART statement. A complete list of options is presented in the section Syntax: UCHART Statement.
Chart Example
The input data set is specified with the DATA= option in the PROC ANOM statement.
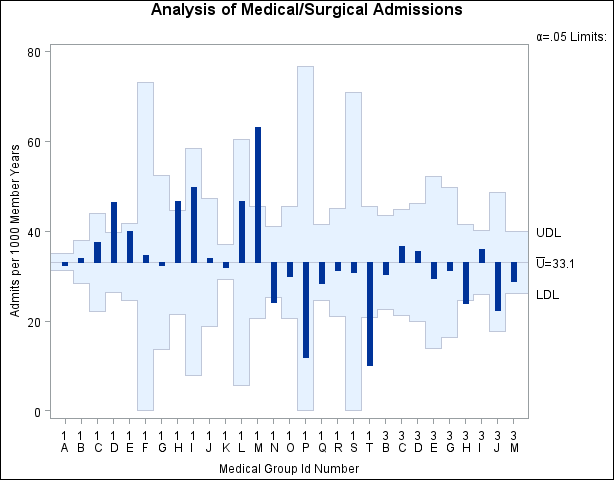
Each point on the chart represents the rate of occurrence, computed as the count divided by the number of opportunity units. The points are displayed in the sort order for the group-variable ID. The chart shows that Clinics 1D, 1H, and 1M have significantly higher admissions rates, and Clinics 1N, 1T, and 3H have significantly lower admissions rates.
By default, the decision limits correspond to a significance level of  . This means that, assuming all clinics have the same rate of admissions, there is a 0.05 probability that one or more of the decision limits would be exceeded purely by chance. The formulas for the limits are given in the section Decision Limits. Note that the decision limits vary with the number of 1000-member-years for each clinic.
For more details on reading count data, see DATA= Data Set.